Step-by-step walkthroughs
Seven walkthroughs, one for each way into the UmaTerra platforms. Each opens a real example — an orchard parcel and a park near Kelowna, a point in the forest, an Indigenous land in Brazil, a spot on the climate map — and follows the analysis in the order the app presents it, saying where each number comes from and where it stops.
The walkthroughs run inside each app, on its own maps, and open quickly because the example's results come precomputed. The footnotes come from the papers that describe the tools. No sign-up needed. Four examples are around Kelowna (BC); the Indigenous-land, drawn-area and batch ones are in Brazil, because the Canada pages offer no drawing or batch runs and do not analyse Indigenous lands.
The walkthroughs and stories are exploratory: generated with automatic measurements and processing, they form an interpretation of the data available in the UmaTerra platforms and have not been validated outside UmaTerra or peer reviewed.
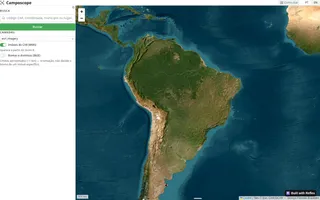
I have a parcel's PID
How to read a parcel in Camposcope, one layer at a time
Read the walkthrough →12 steps
- From a PID to a polygon
- What the fabric says, and what it does not
- Three bands out from the property line
- Fifteen crop inventories in one chart
- The parcel against its neighbourhood
- Where every hectare came from
- Twenty-five years of tree-cover loss
- Biomass: a model, with a larger error
- Fire, at a coarser scale
- Two maps, two answers
- Where every number came from
- What Camposcope does not say
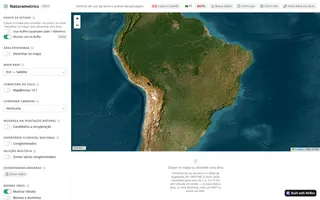
I want to read the landscape around a point
How to read the landscape around a point, one layer at a time
Read the walkthrough →10 steps
- It all starts from a point
- Five circles around the point
- Fifteen crop inventories in one circle
- Near and far tell different stories
- The point's own pixel, no averaging
- How old the forest is
- Tree cover lost and gained, circle by circle
- The years that stand out
- Everything on screen, in one spreadsheet
- What Naturametrics does not say
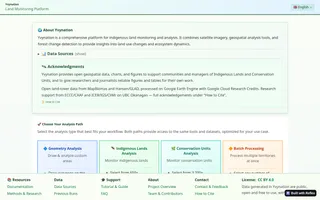
I follow an Indigenous land
How to read an Indigenous land in Yvynation, from the inside out
Read the walkthrough →10 steps
- Pick the land from FUNAI's catalogue
- Ten kilometres around, for comparison
- Inside and out, in the latest year
- Forty years in three snapshots
- What became what
- A second opinion on the forest
- Year by year: clearing, regrowth and fire
- The same line, inside and out
- Report, tables and maps to take away
- What Yvynation does not say
I follow a protected area
How to read a protected area, one layer at a time
Read the walkthrough →10 steps
- Pick the park from the national register
- Three bands around the boundary
- Fifteen years of cover inside the park
- The park against its neighbourhood
- What became what
- Tree cover lost, year by year
- The fire, seen from orbit
- Two maps, two answers
- Where every number came from
- What Yvynation does not say
My area isn't on any official map
Draw the area: the question no official map asks
Read the walkthrough →10 steps
- Draw, or upload a file
- Ten kilometres around, for comparison
- Inside and out, in the latest year
- Forty years in three snapshots
- What became what
- A second opinion on the forest
- Year by year: clearing, regrowth and fire
- The same line, inside and out
- Report, tables and maps to take away
- What Yvynation does not say
I need to compare many territories
A hundred territories in an afternoon: batch processing, step by step
Read the walkthrough →7 steps
- Pick many areas at once
- Check before spending an afternoon
- Years, analyses, figures and the surrounding zone
- Running unattended
- One file, with everything inside
- What even a small batch can answer
- What the batch does not say
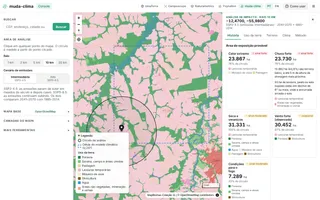
I want to know what climate a place is exposed to
How to read the climate exposure of a place, one layer at a time
Read the walkthrough →18 steps
- A point, a circle and a climate cell
- What is in the circle today
- Where today's land came from
- Nine climate models, each compared with itself
- How to read a projection
- Heat: the signal everyone agrees on
- Rain: where the models most often split
- Middle or high emissions: still close by 2050
- Which world, and where it already exists
- What has already been measured, and when two records disagree
- Wind: only what was measured
- Terrain decides where heavy rain does harm
- A decade of fire
- The fire danger ahead
- The climate class inside the circle
- Hazard × land use = exposed area
- A written story, and the data's fingerprint
- What climate-shift does not say