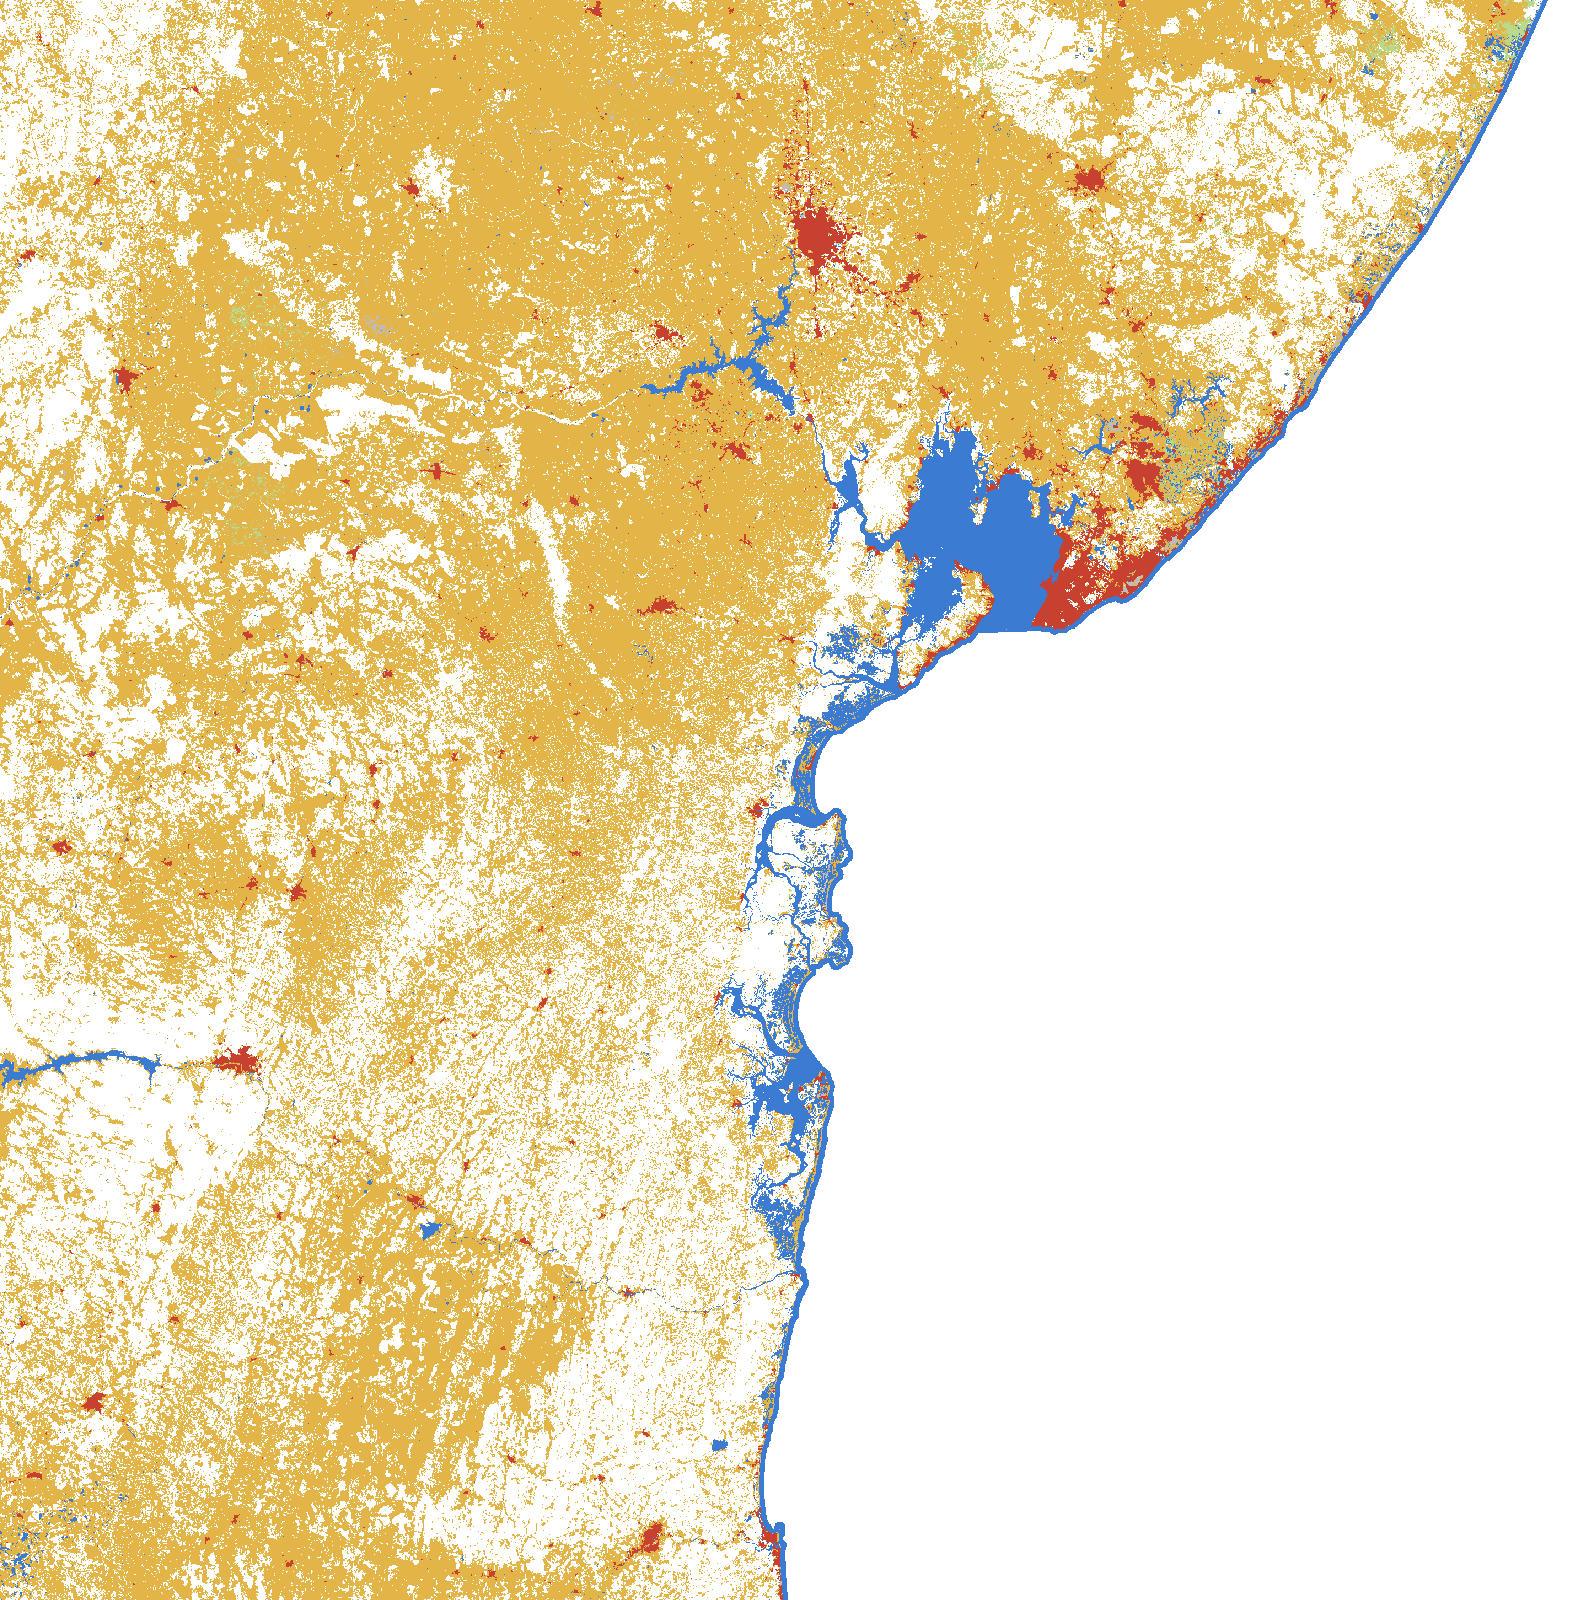
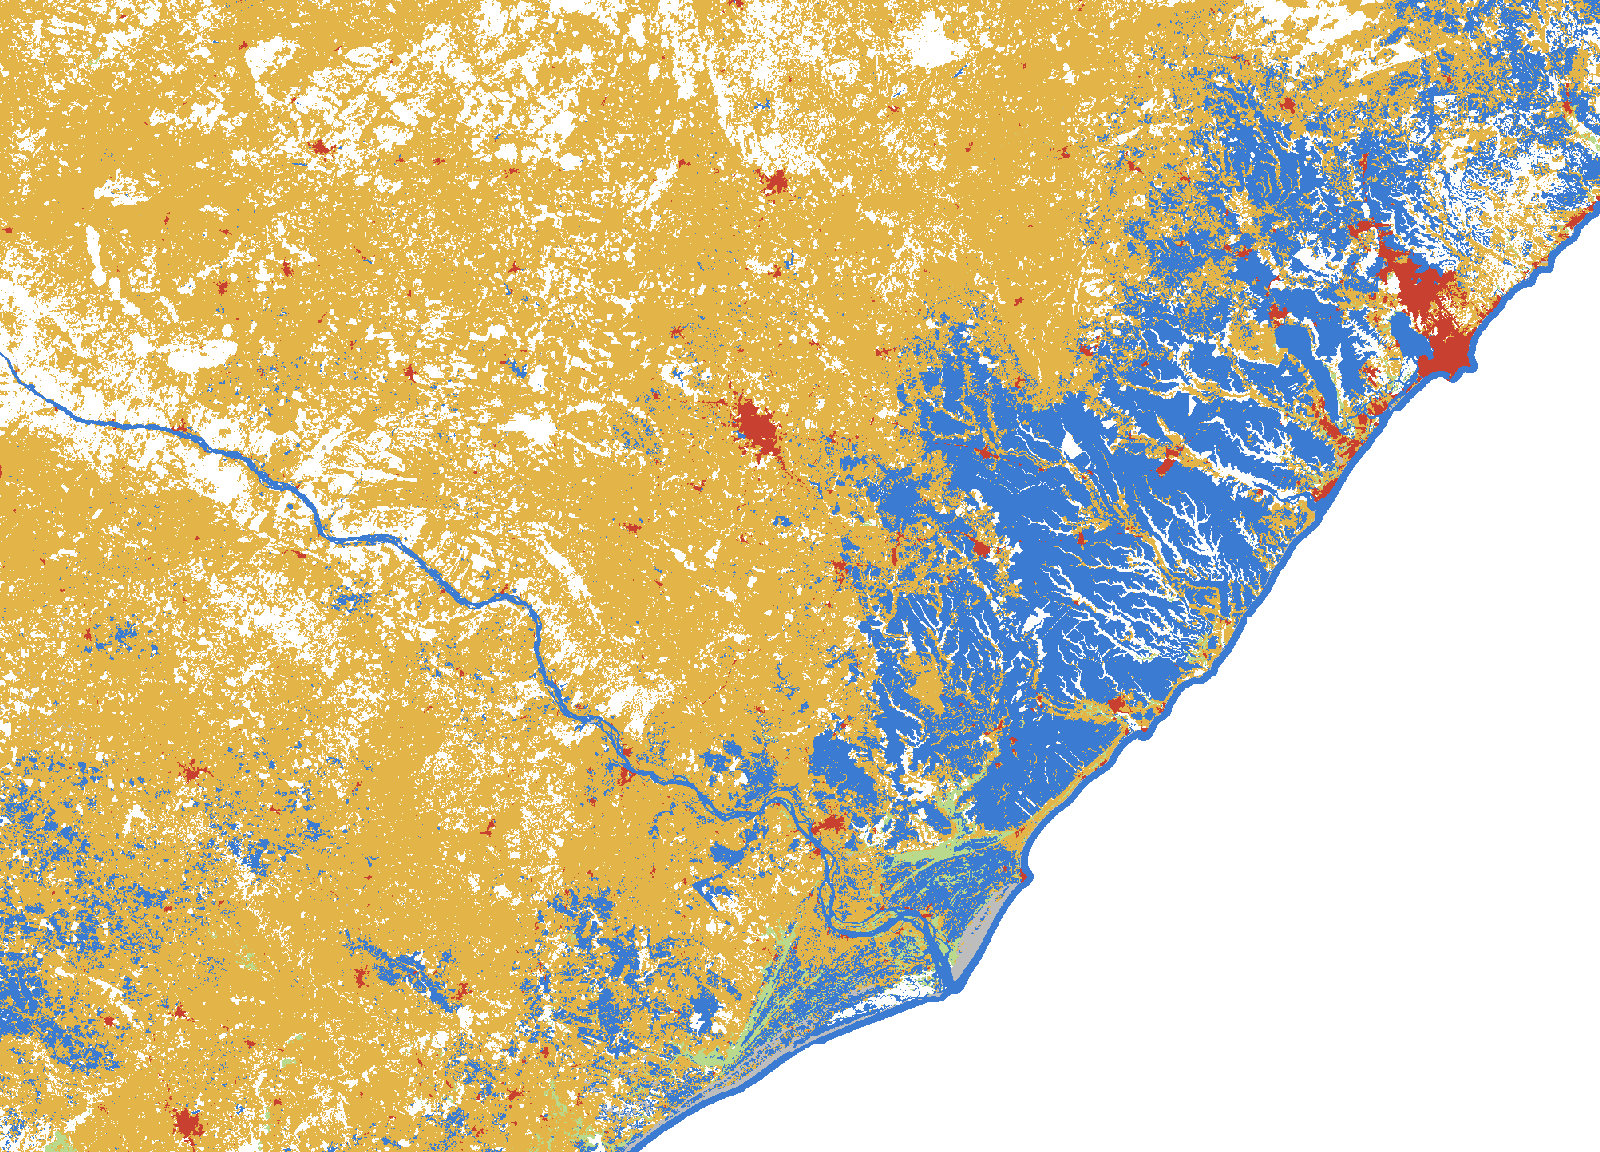
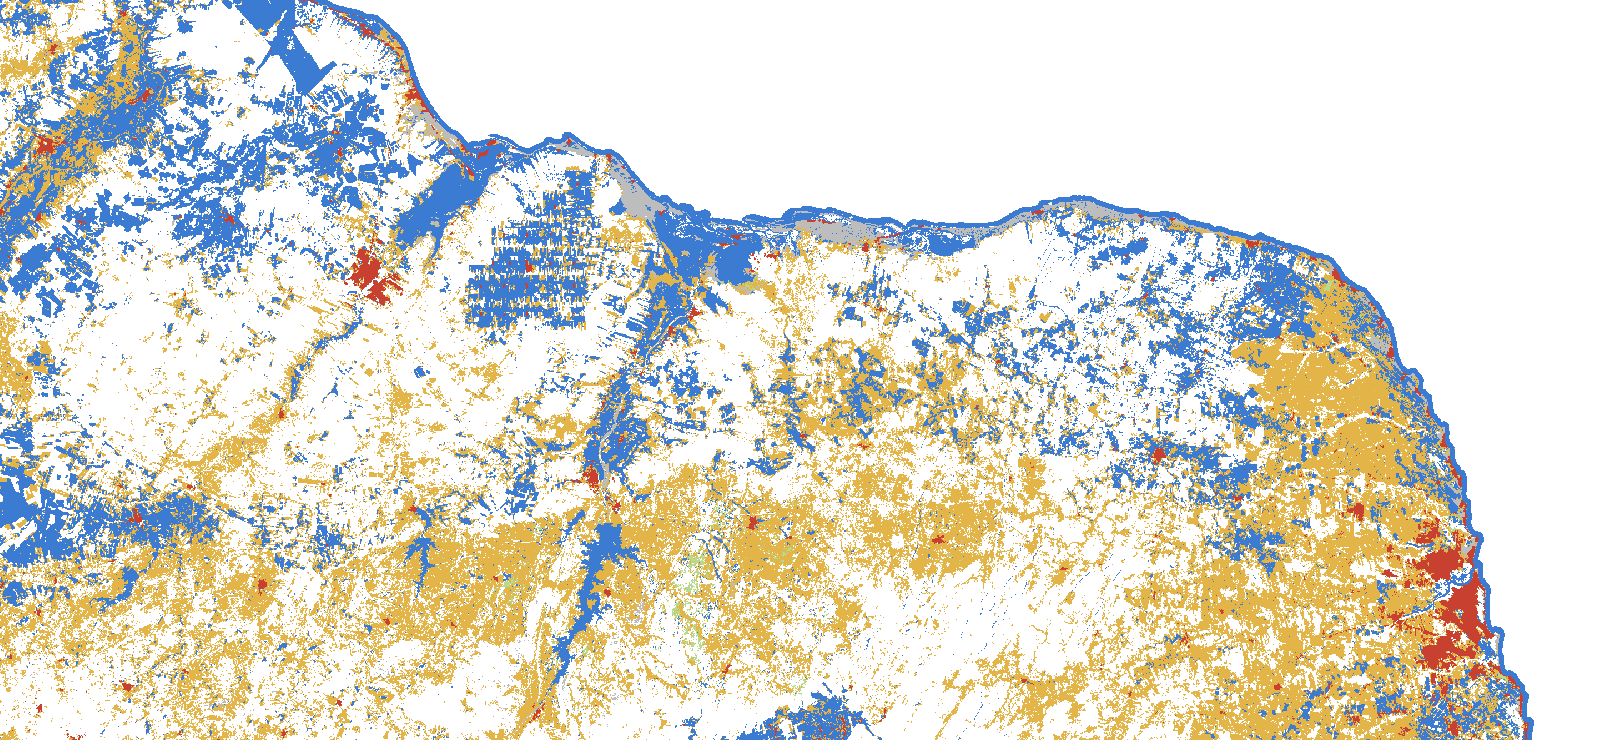
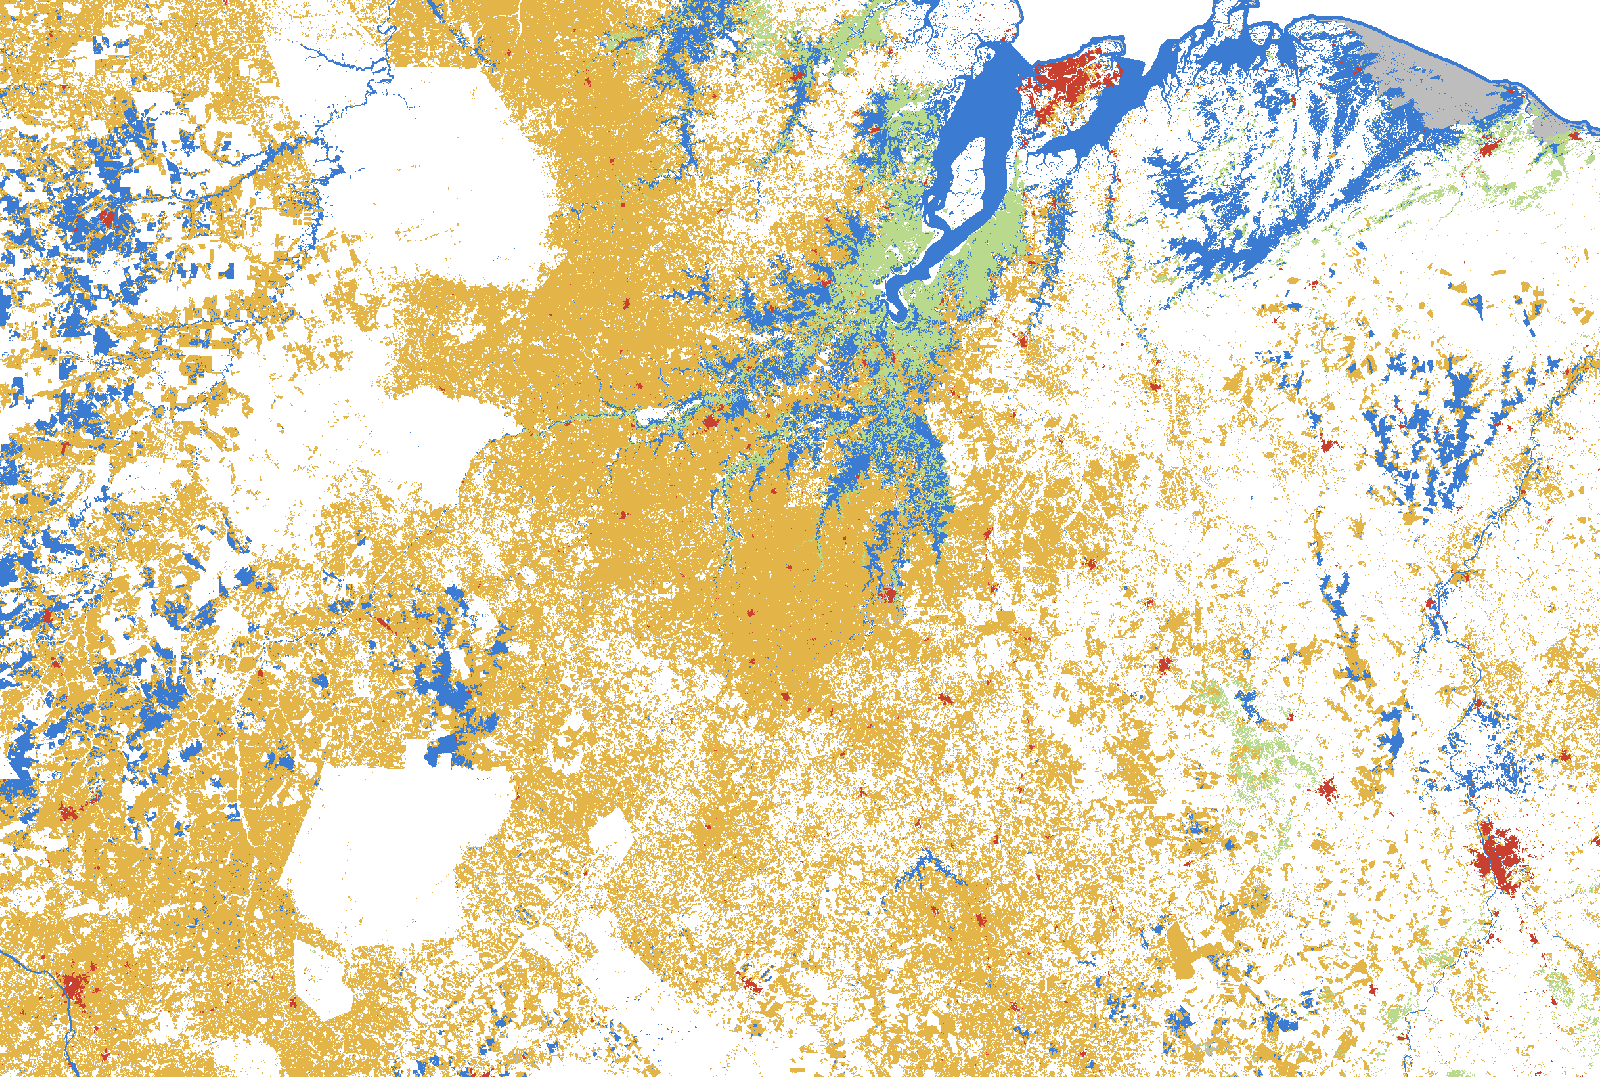
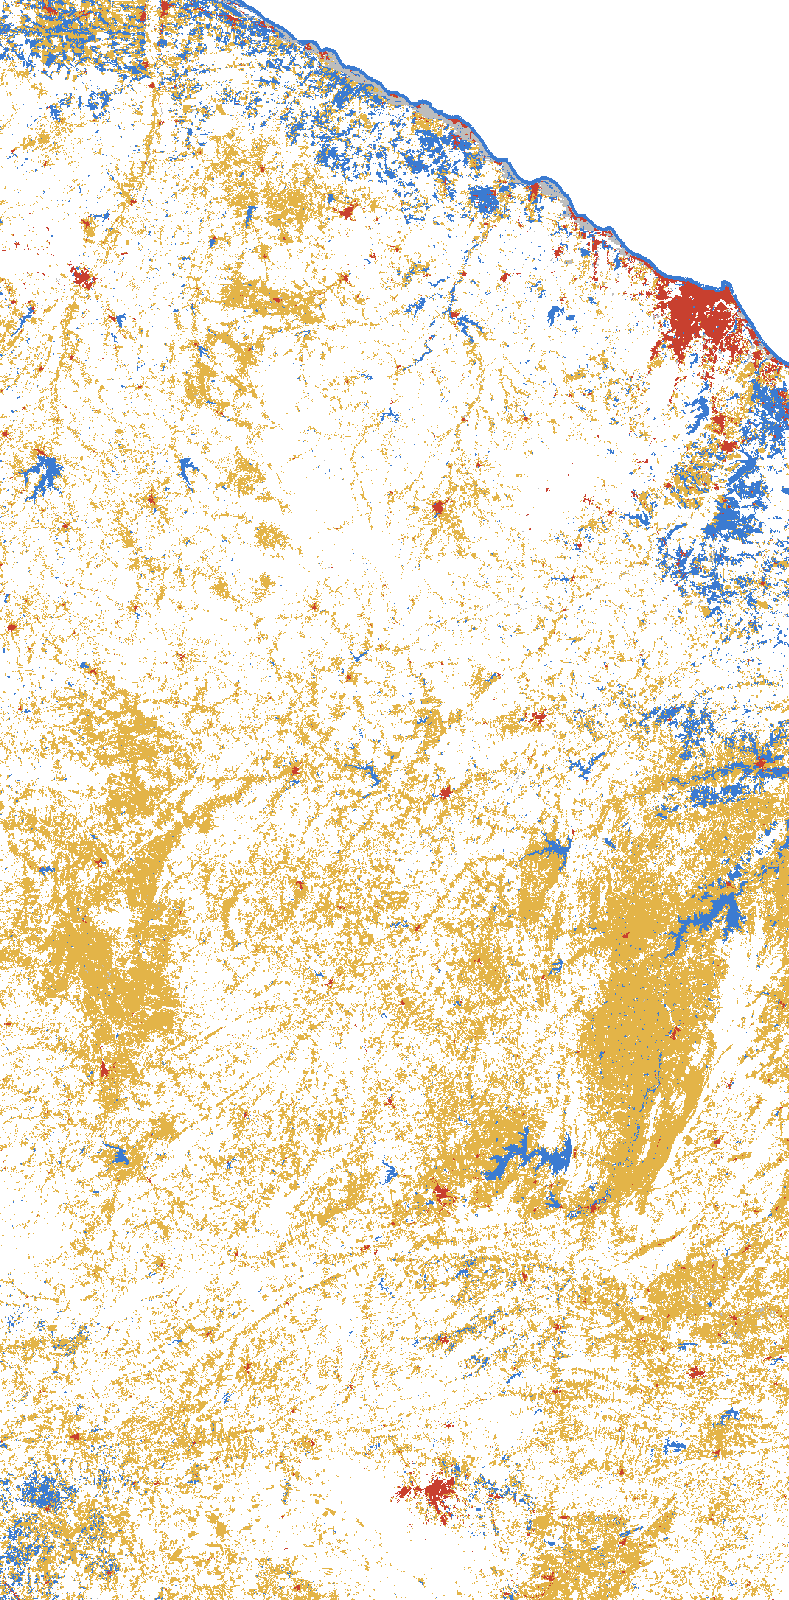
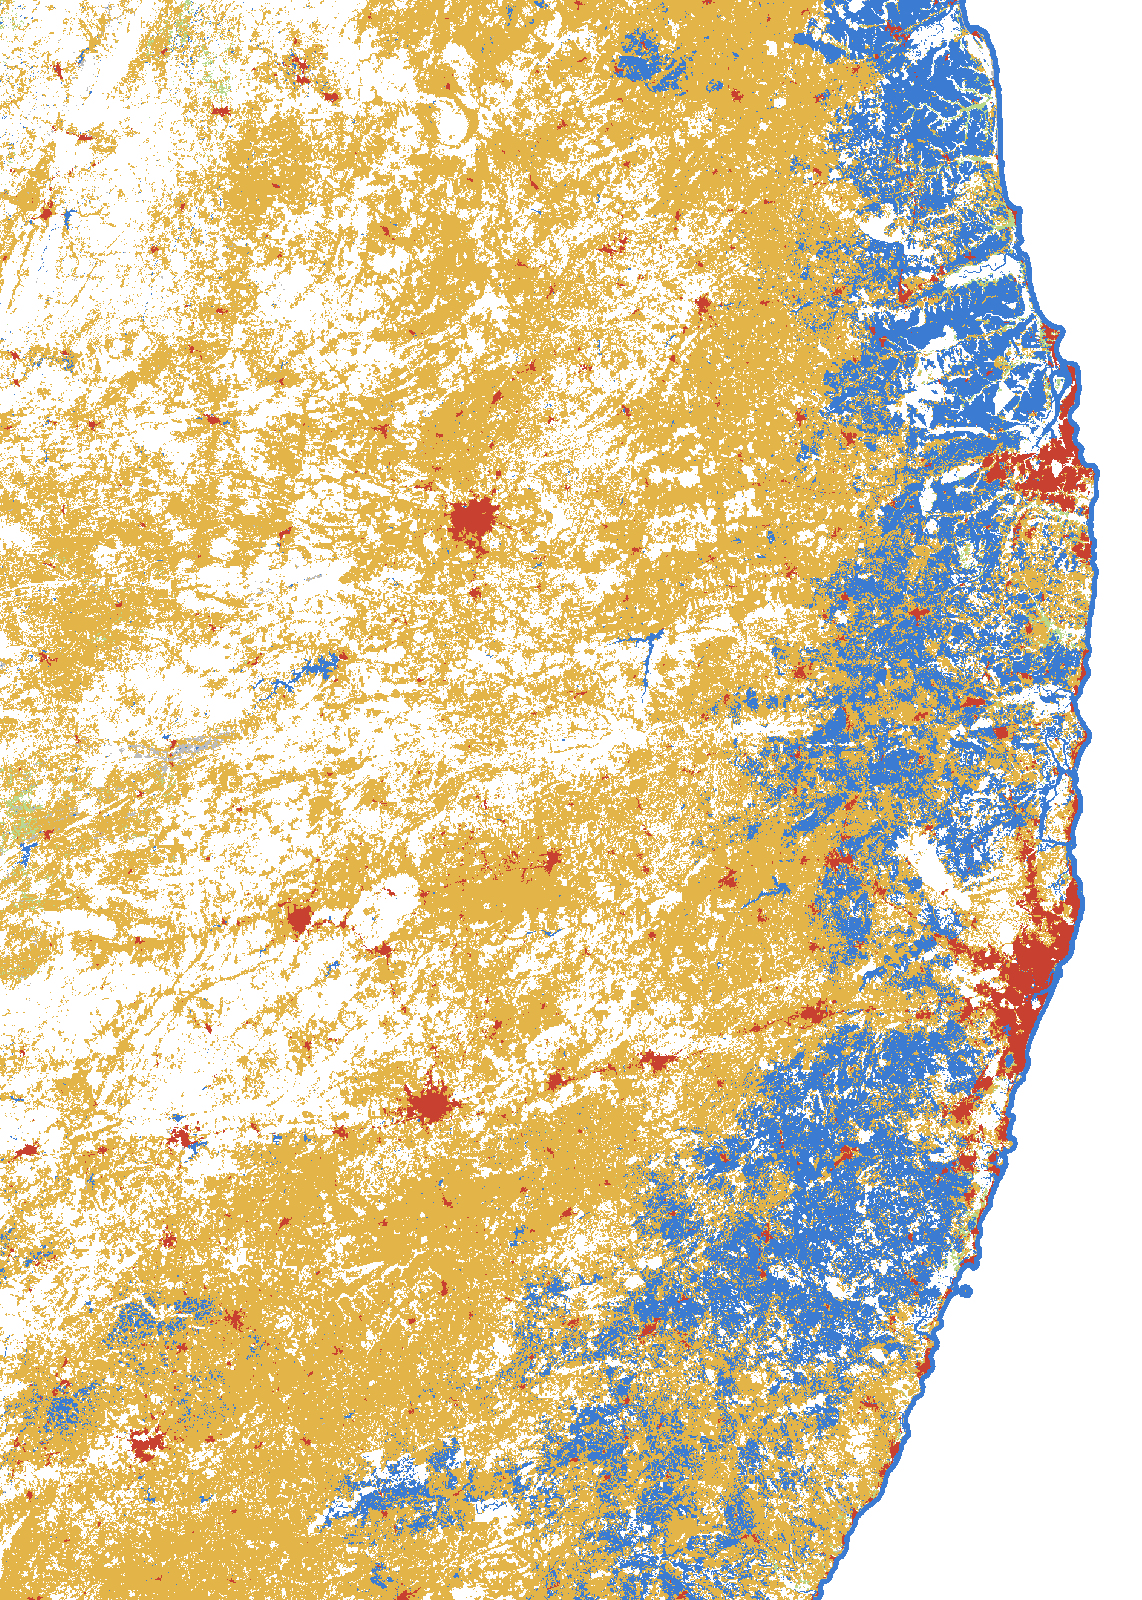
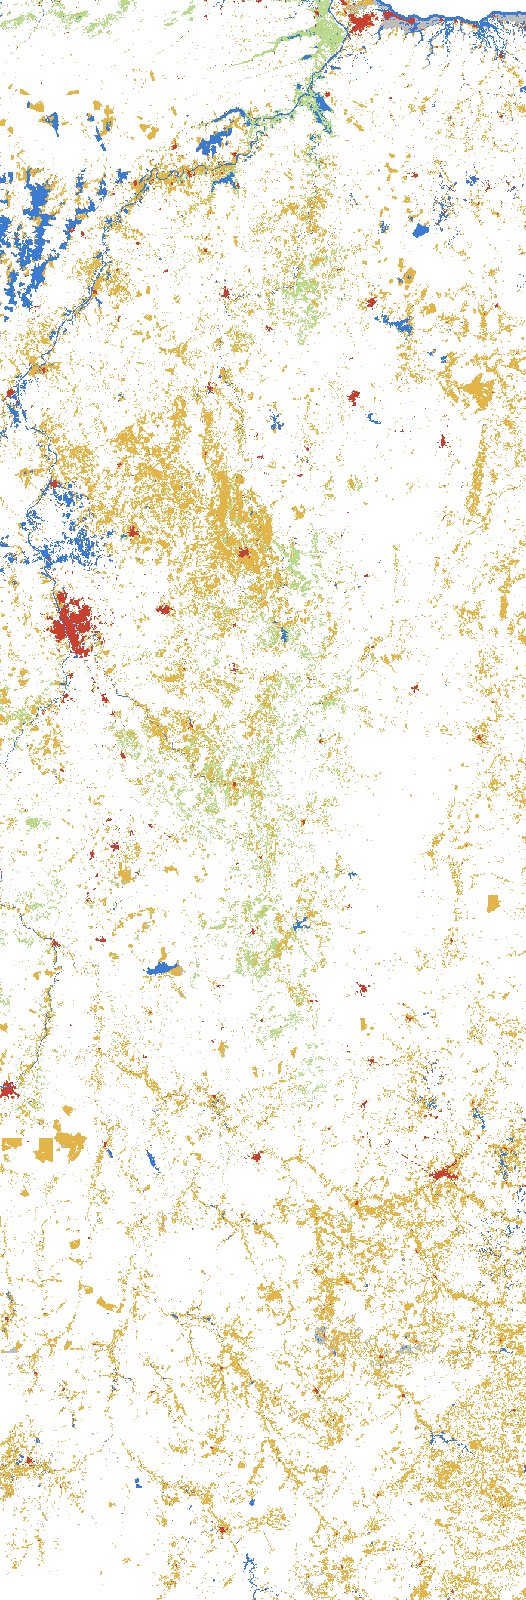
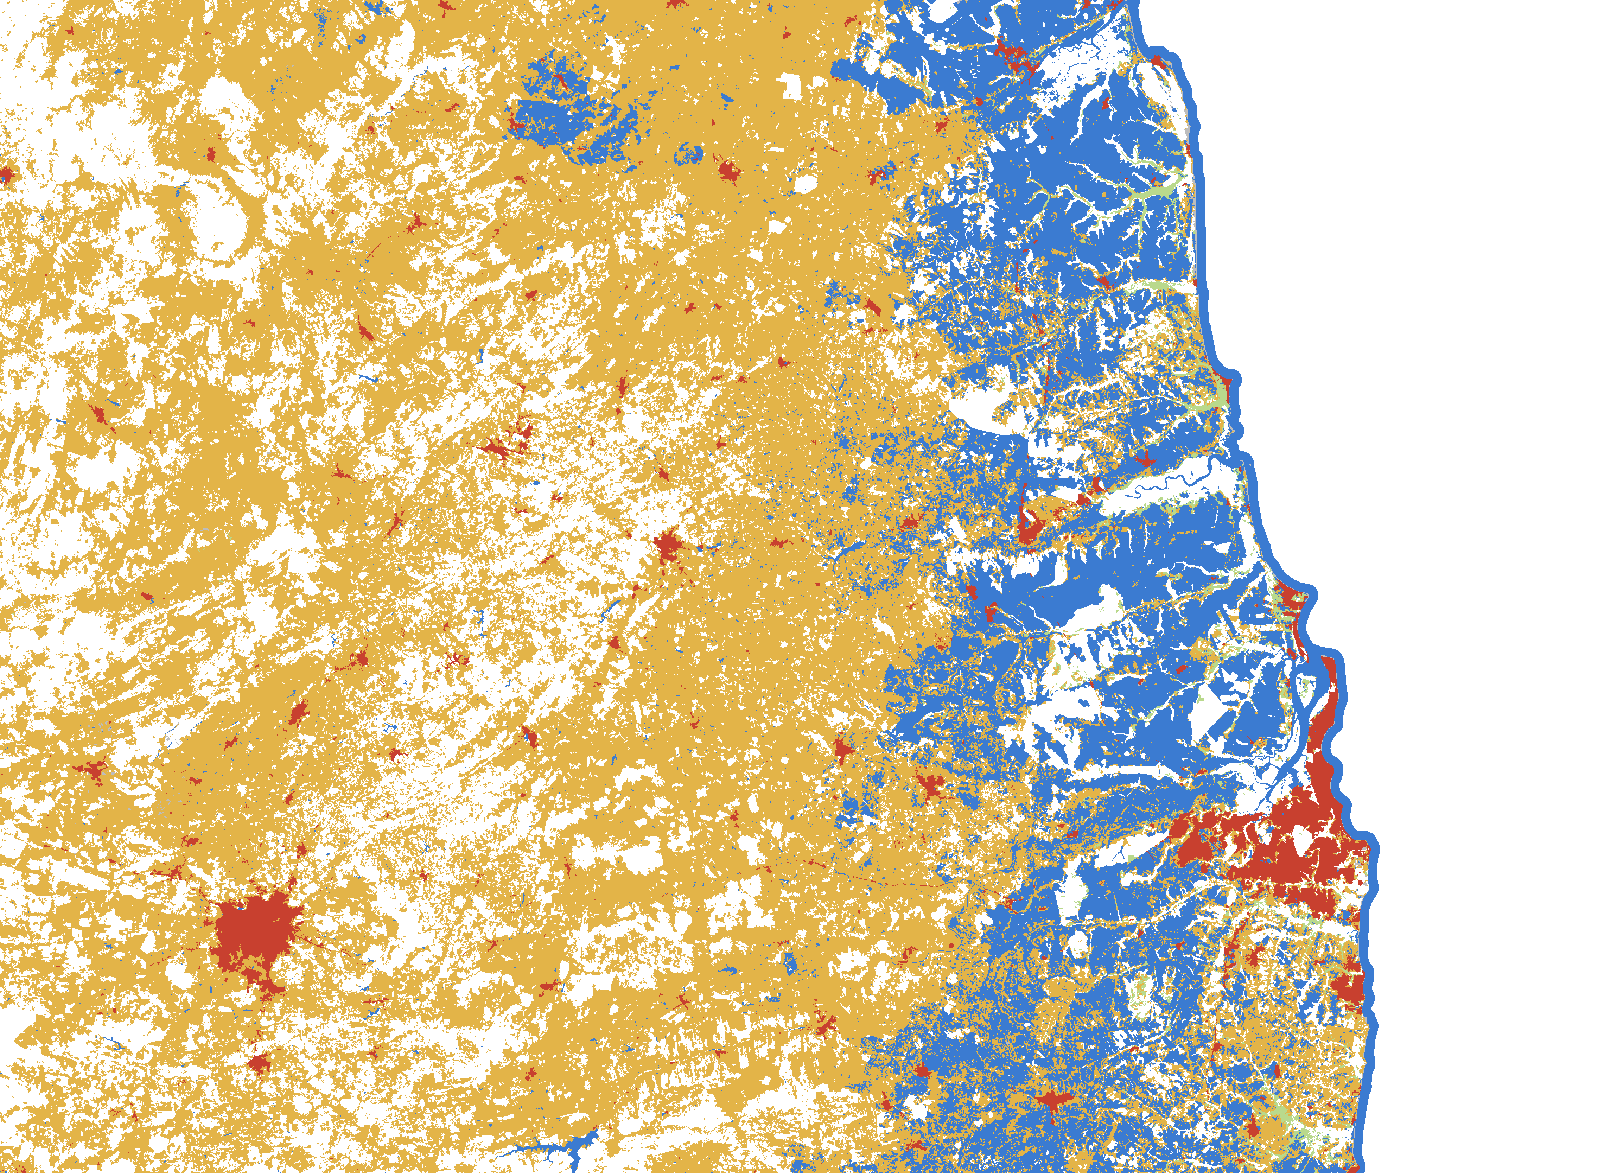
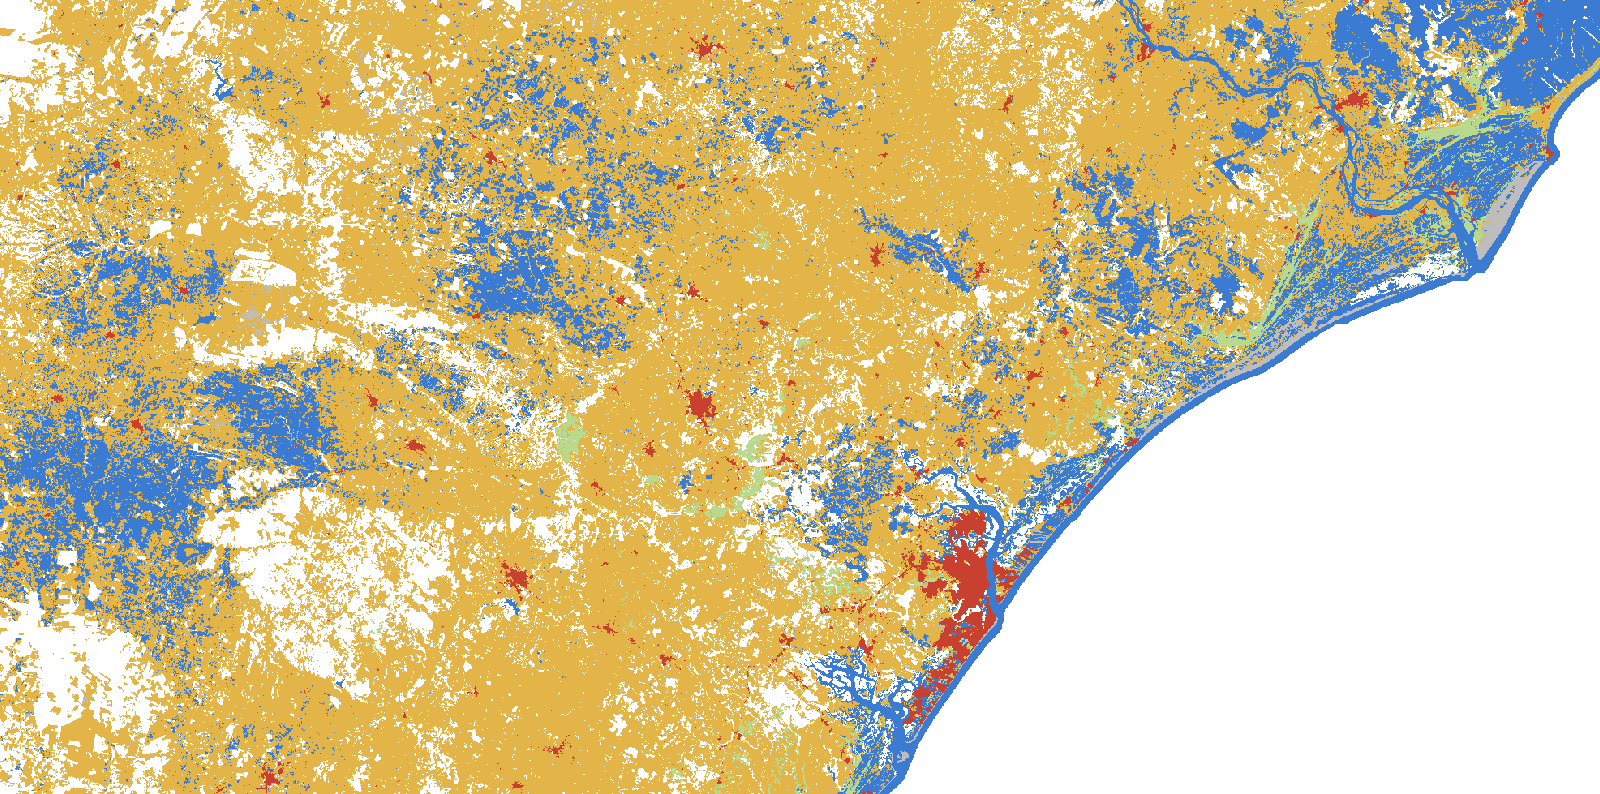
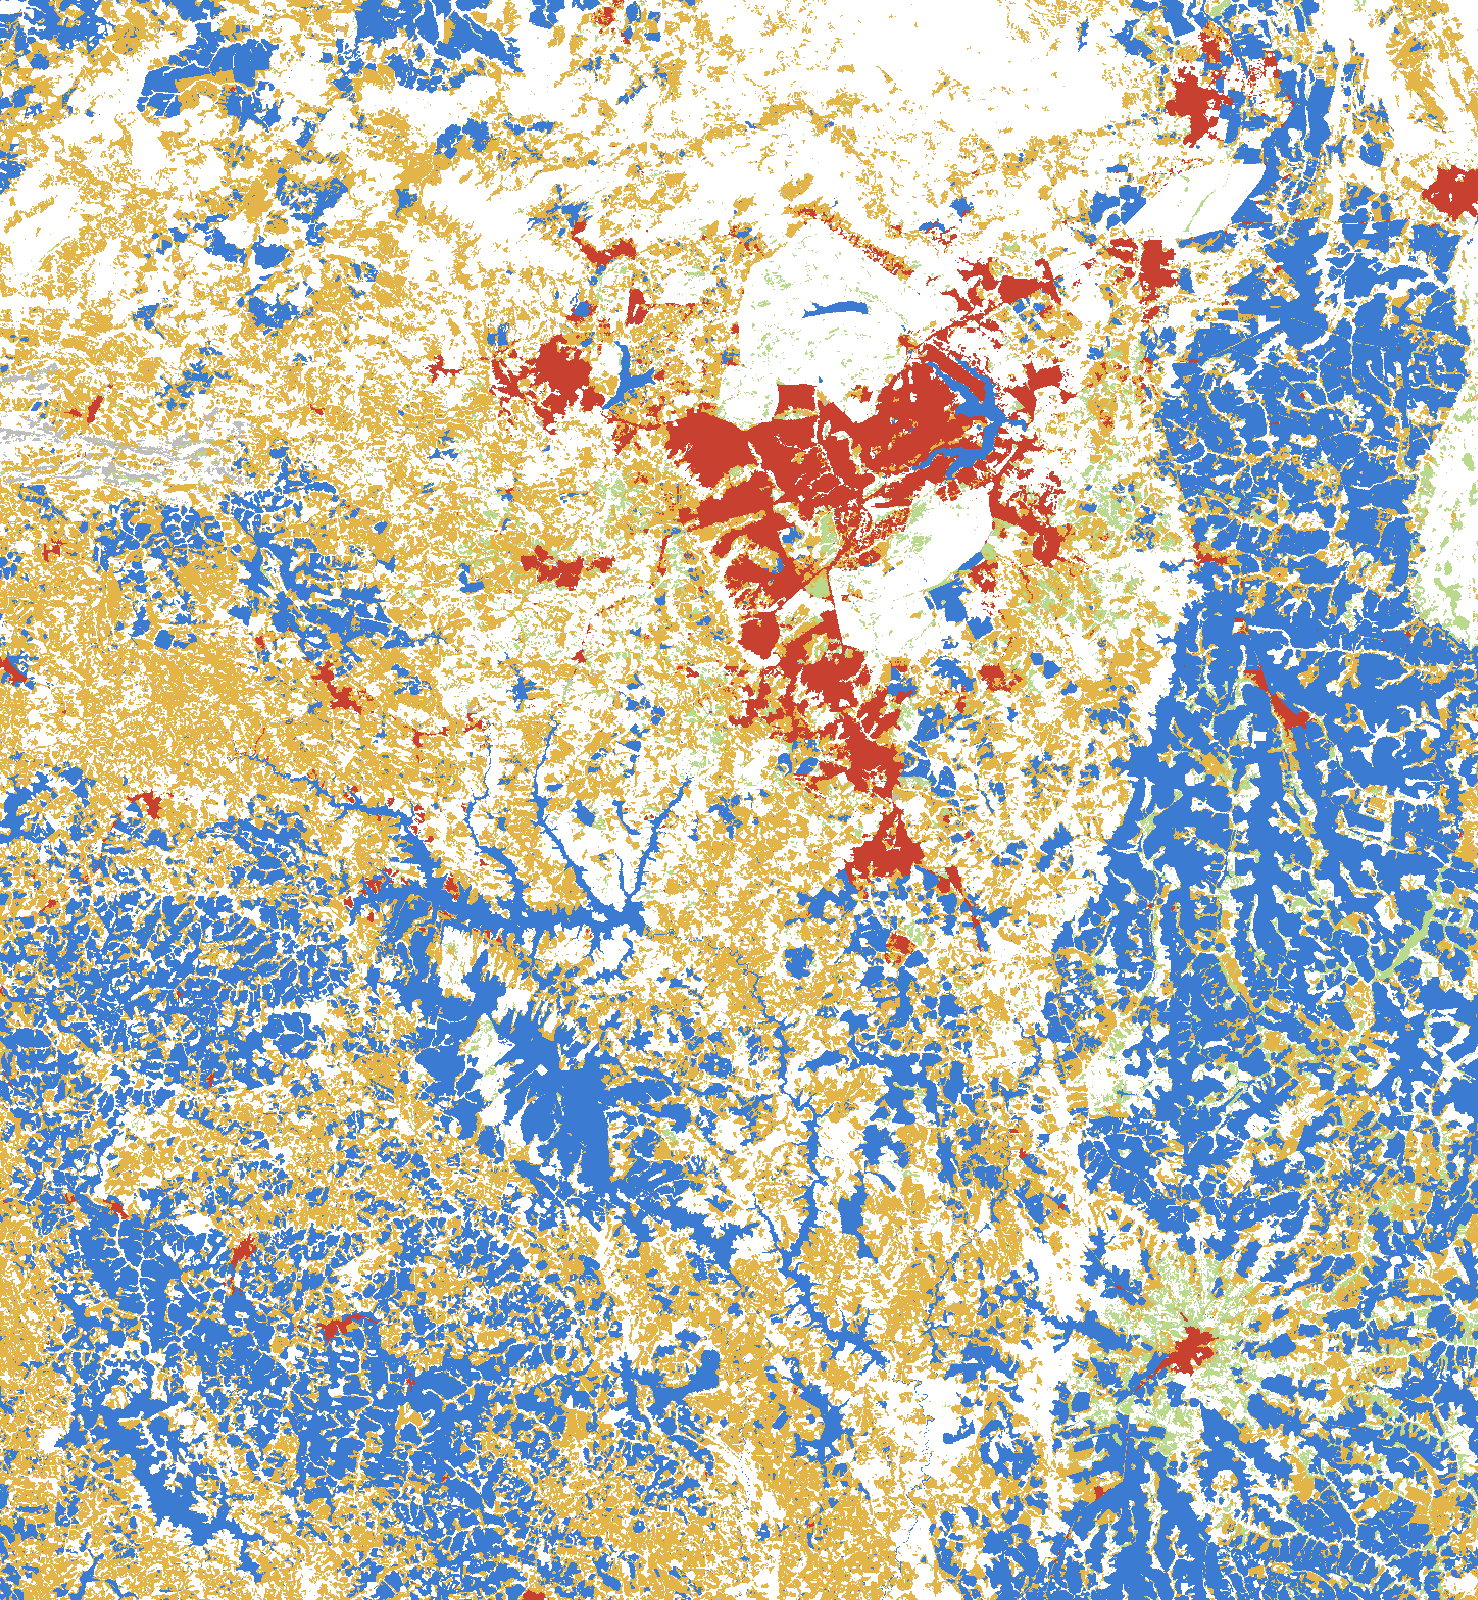
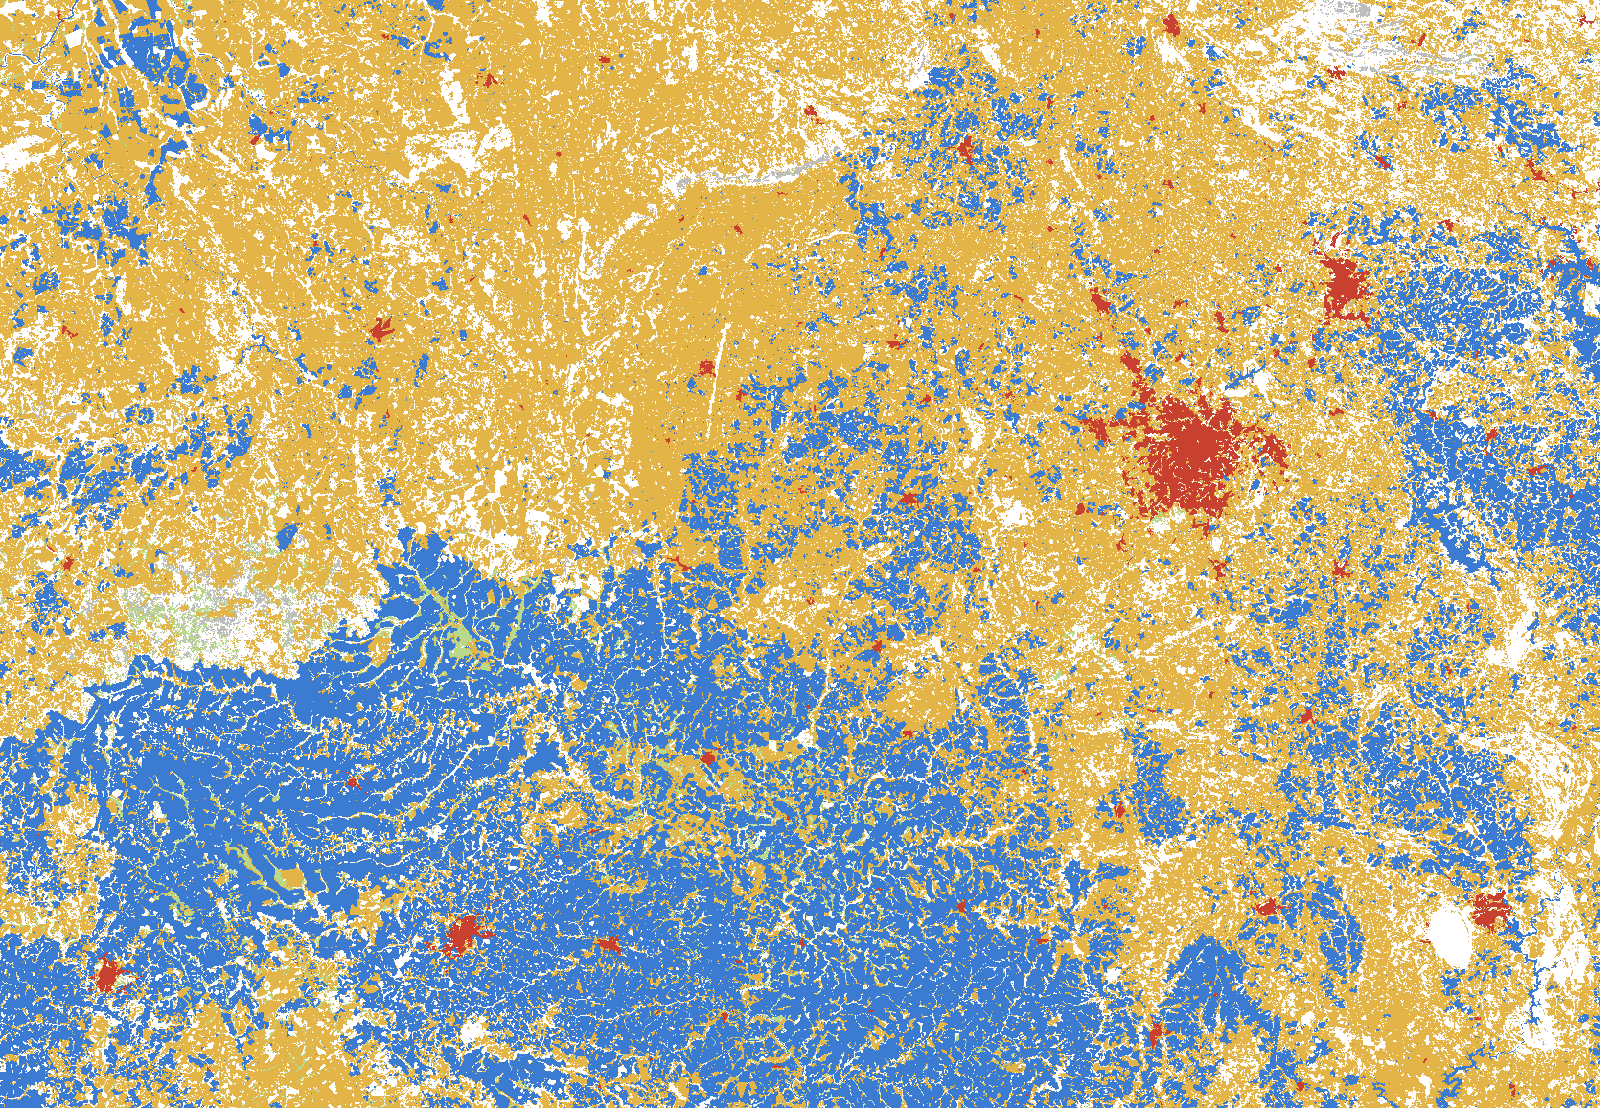
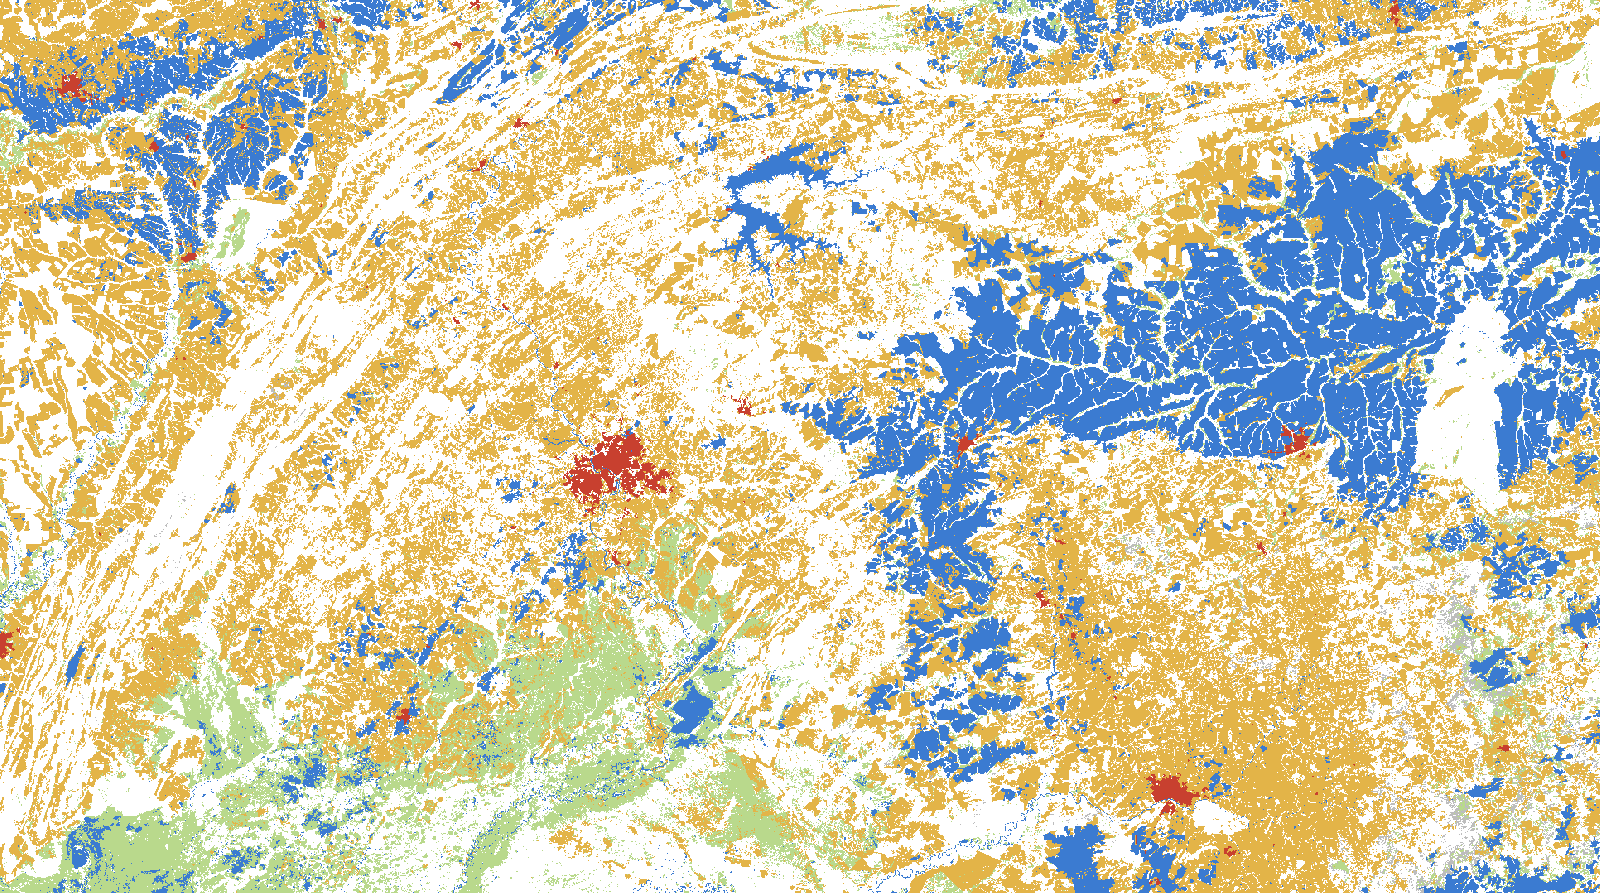
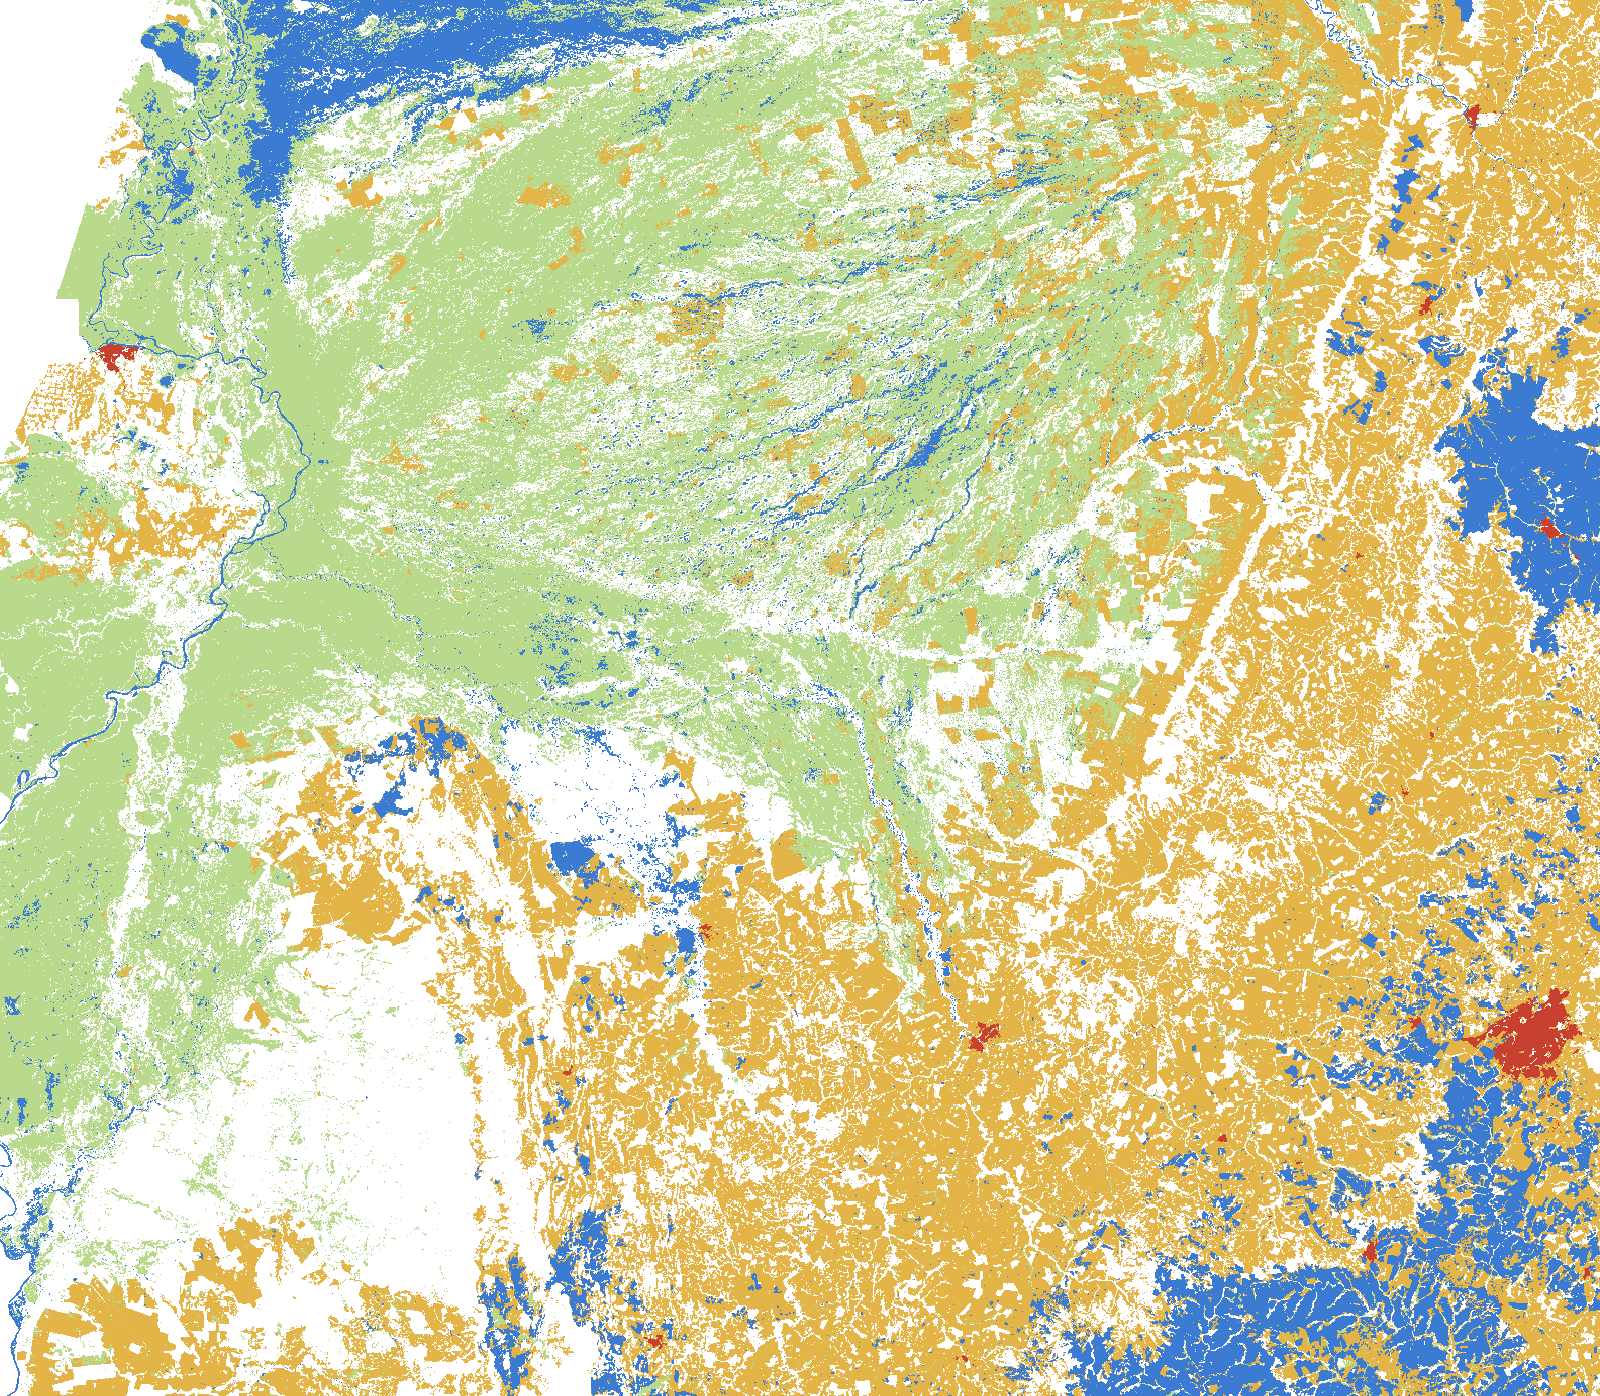
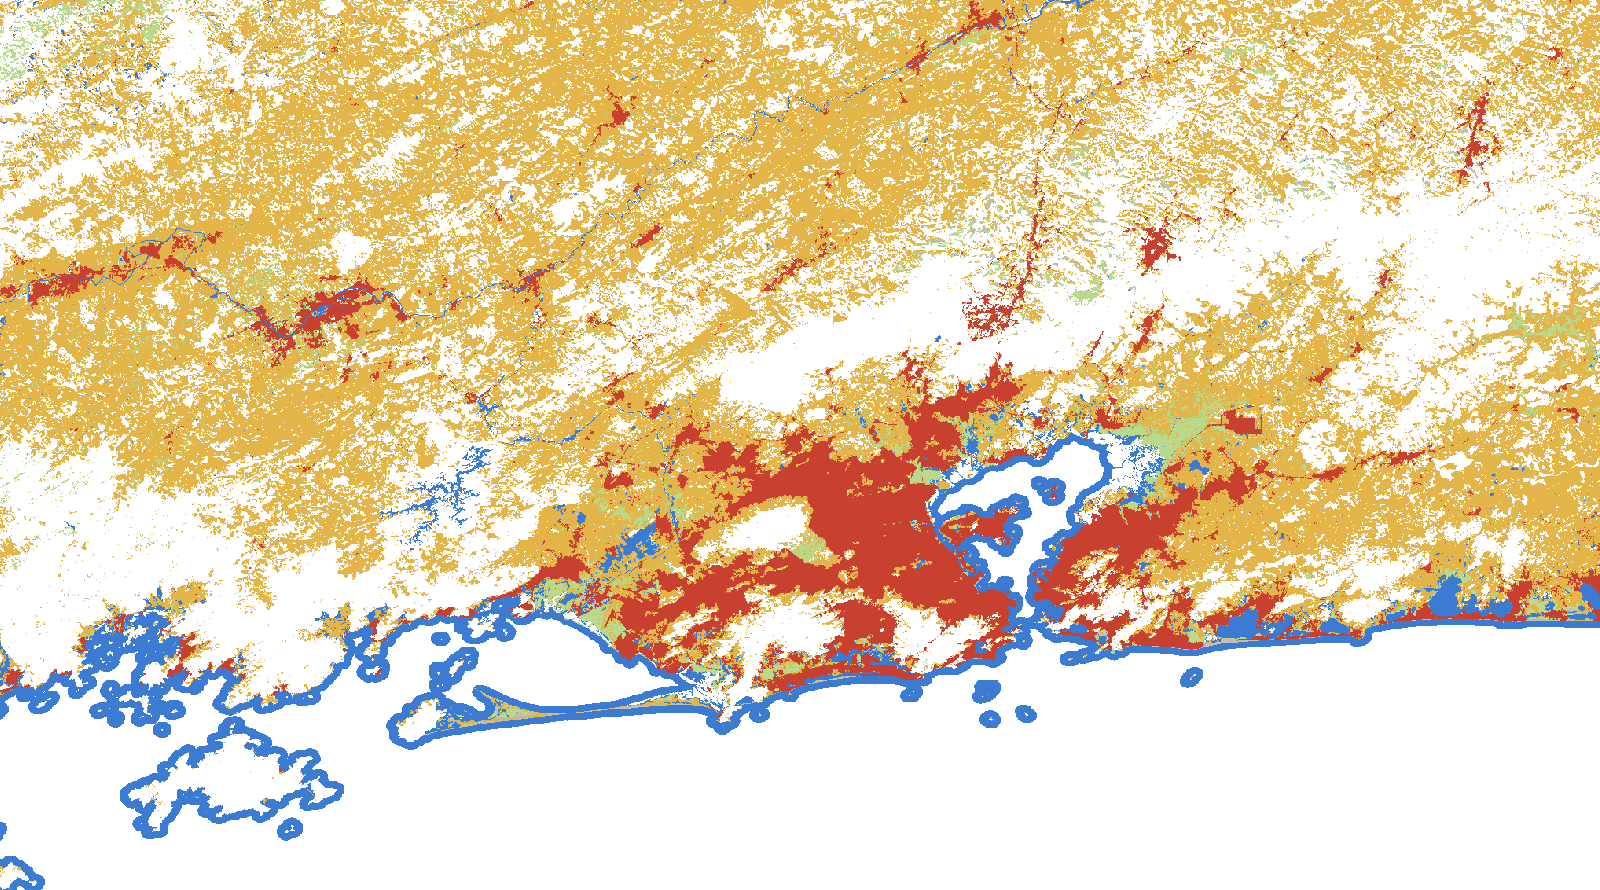
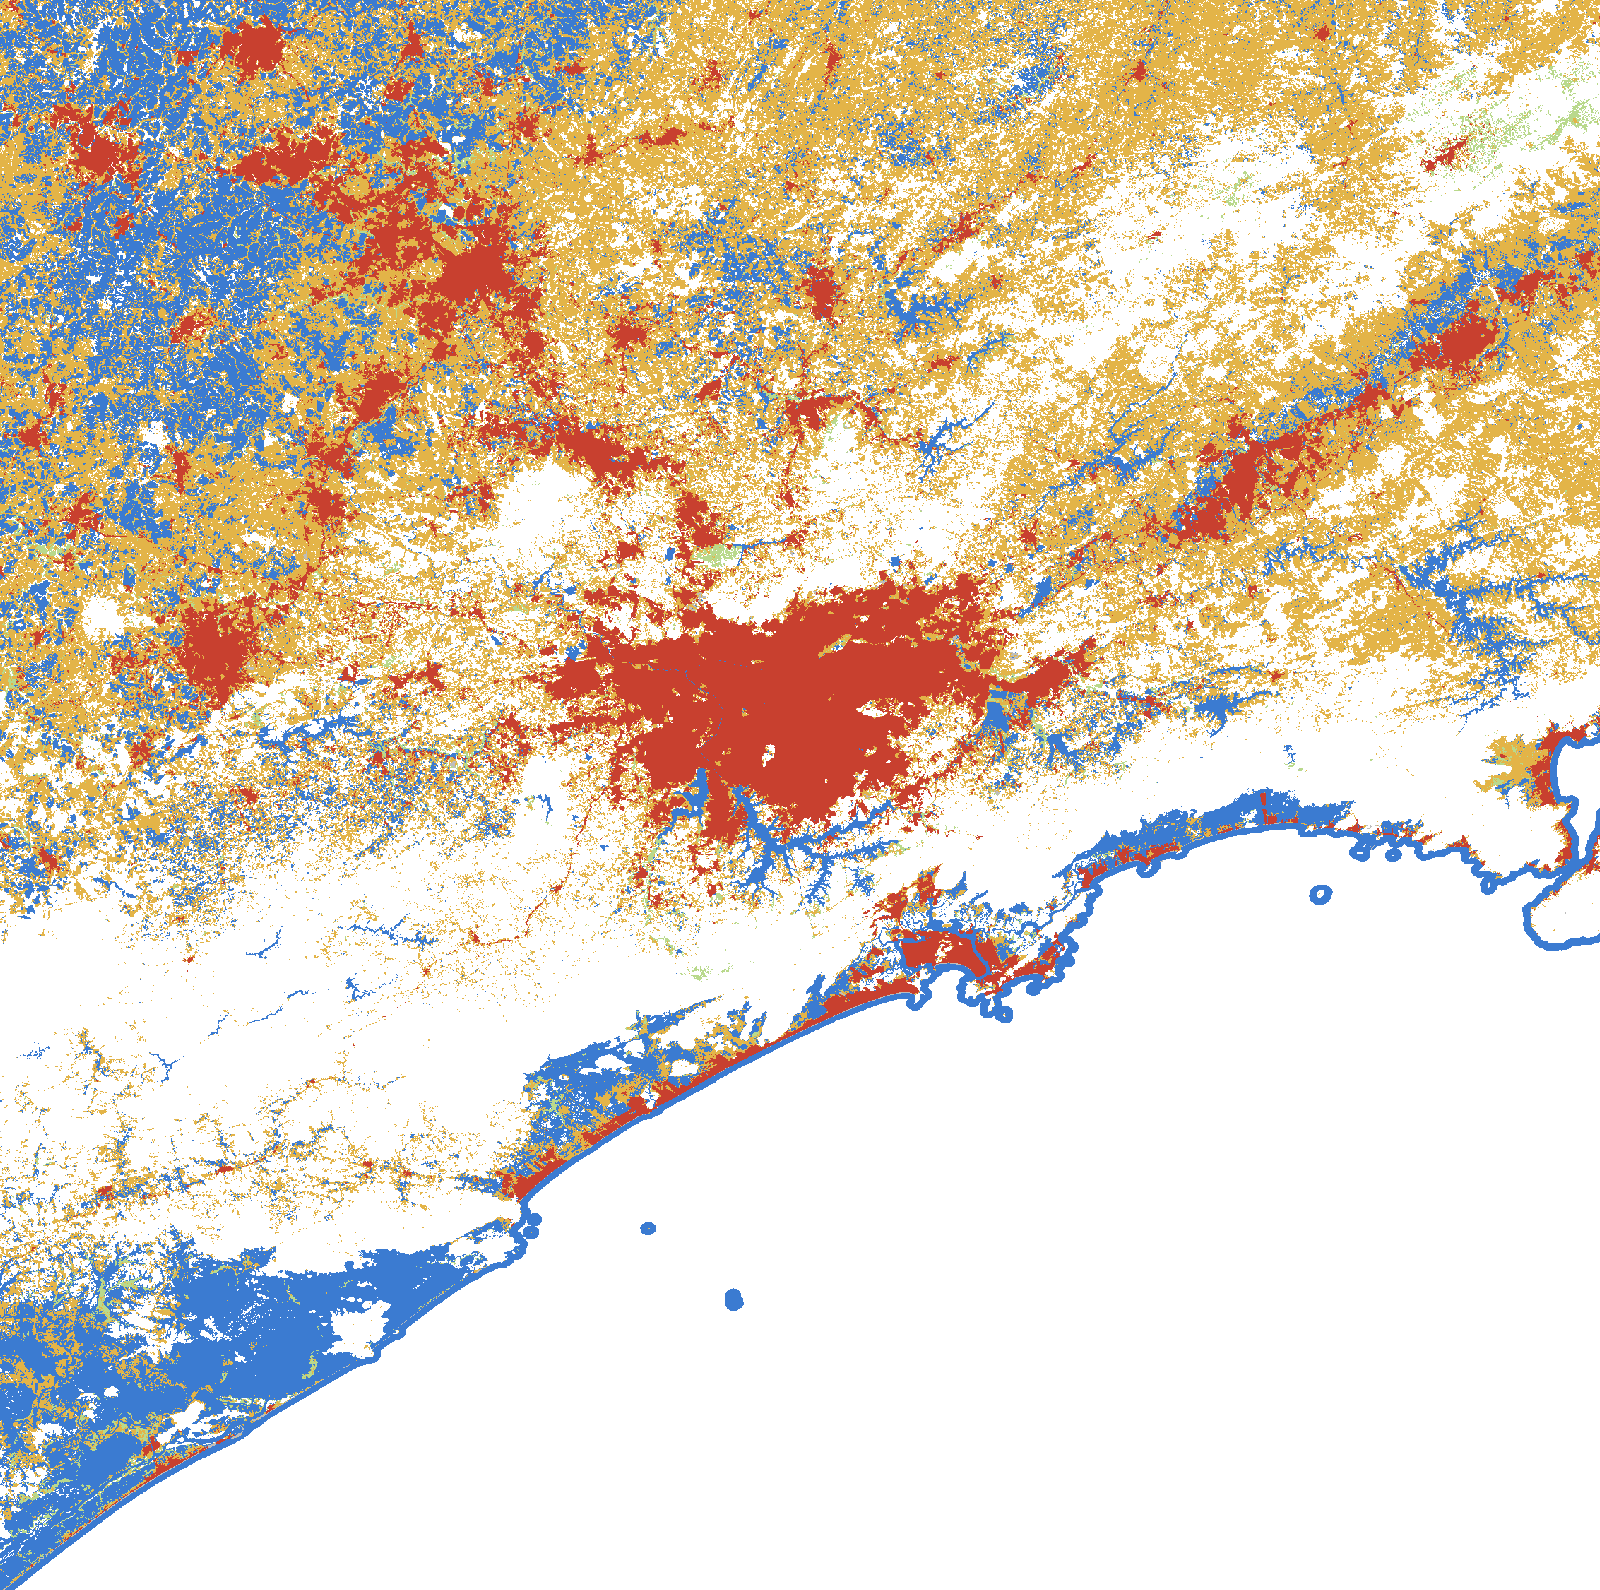
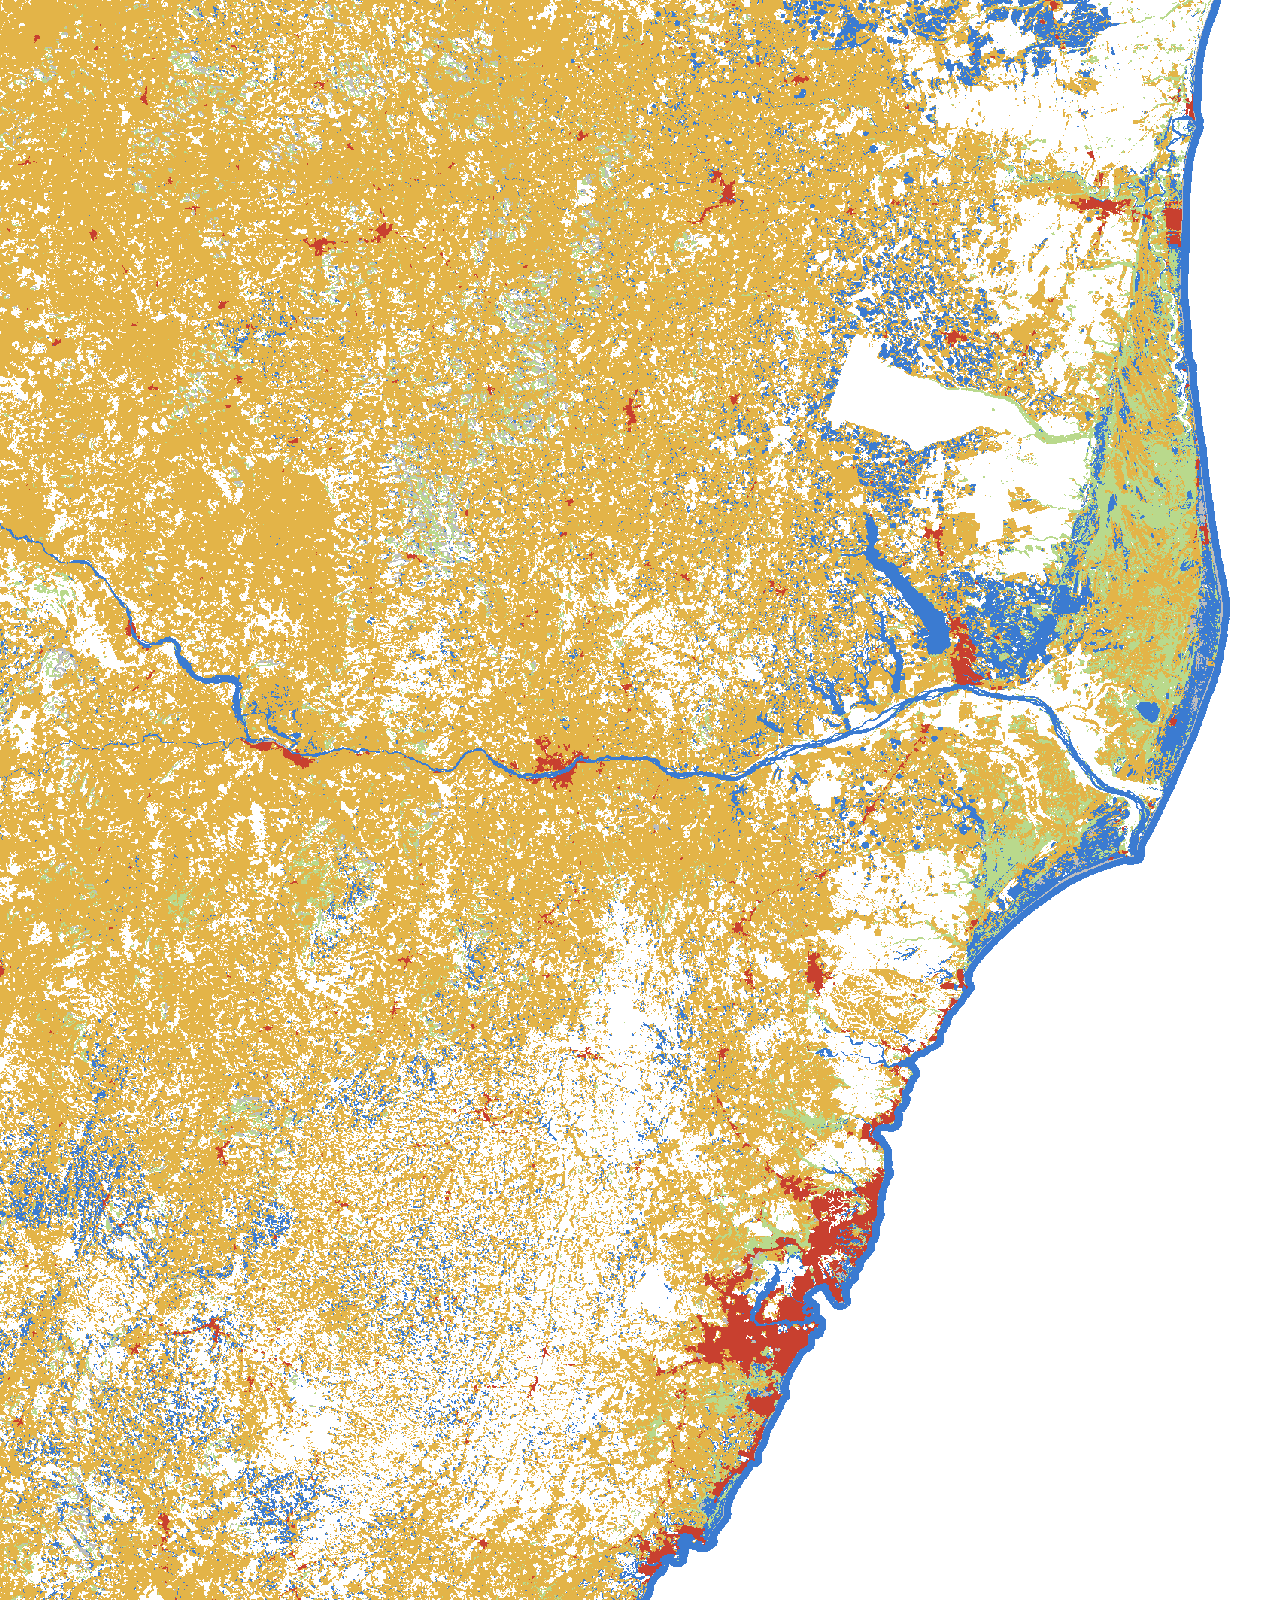
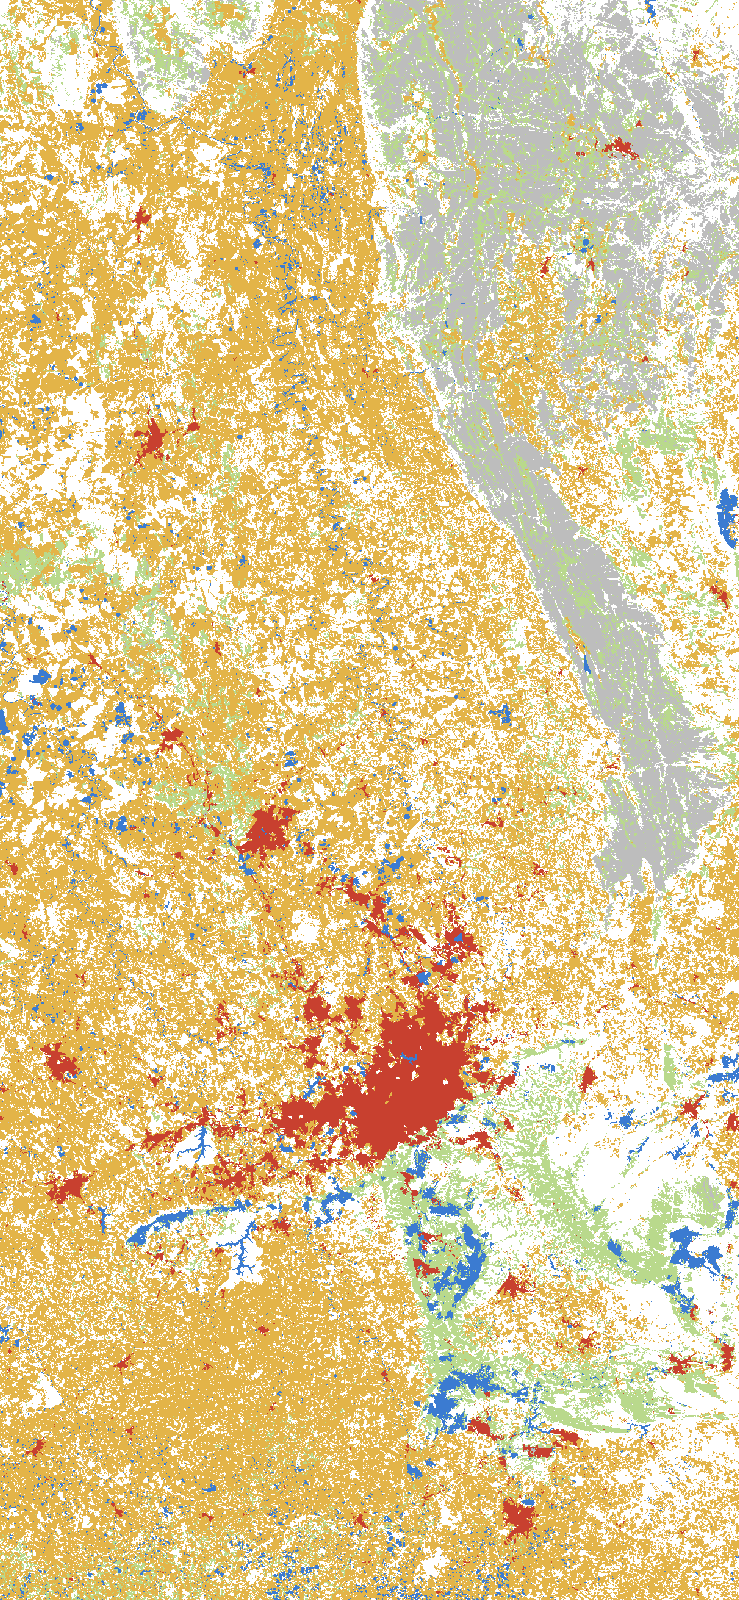
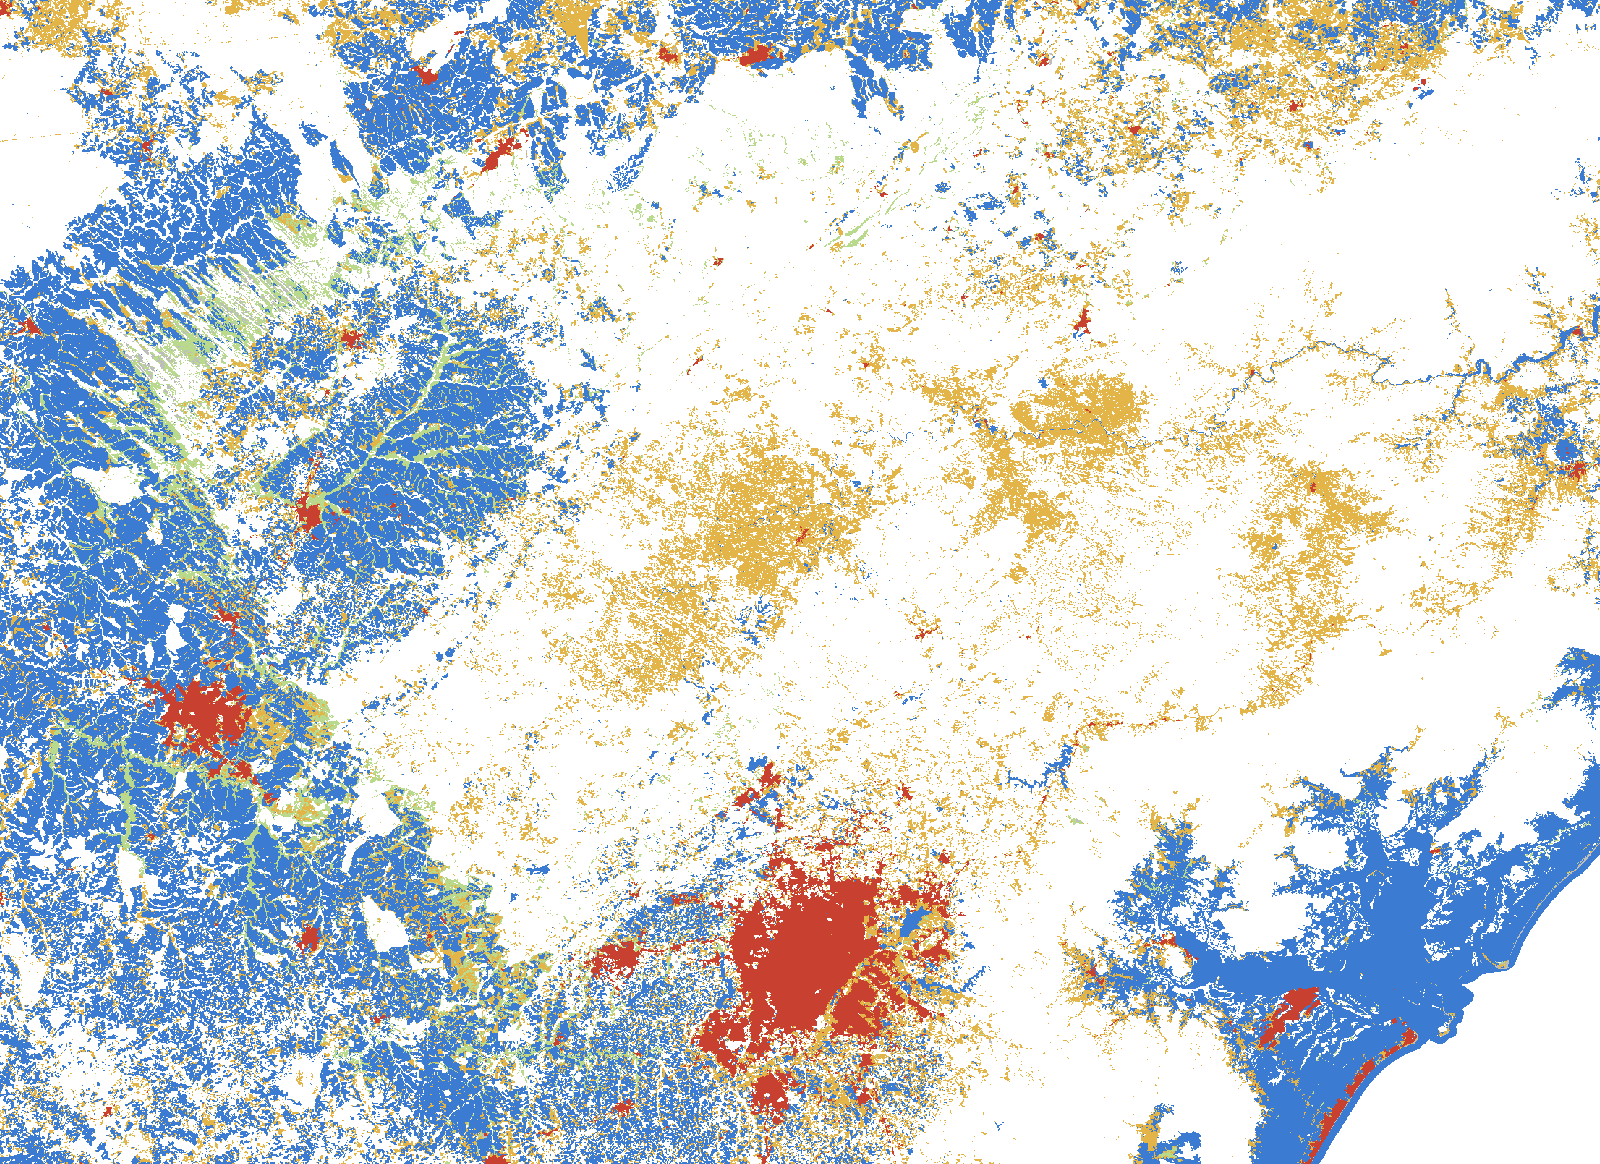
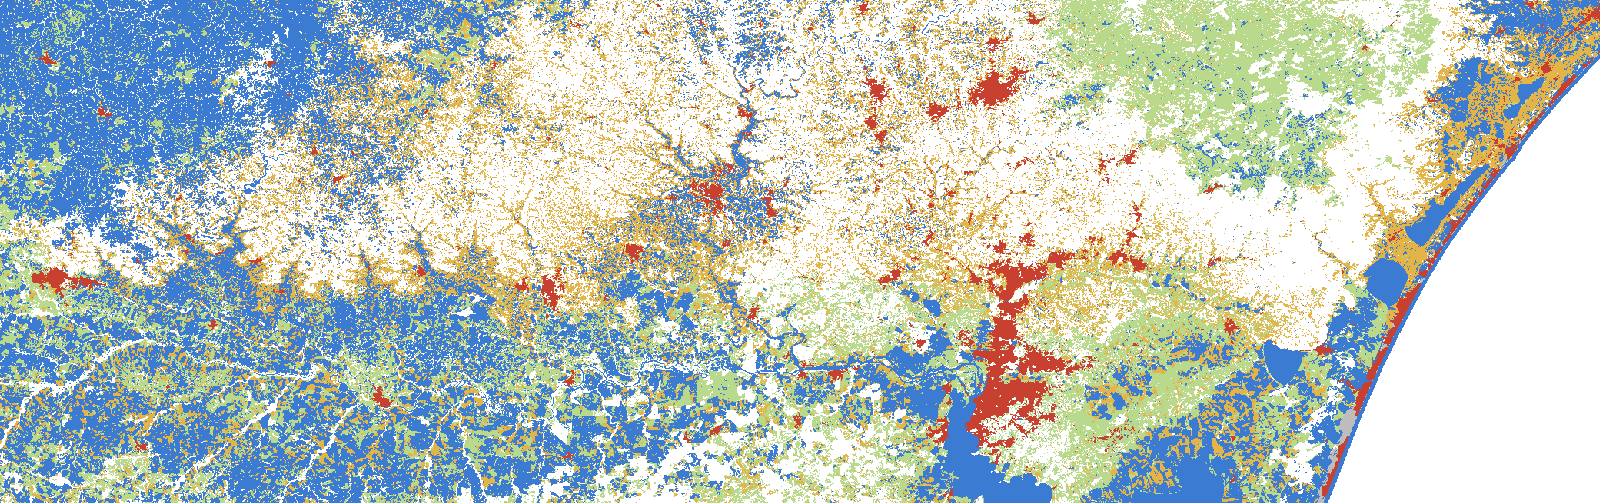
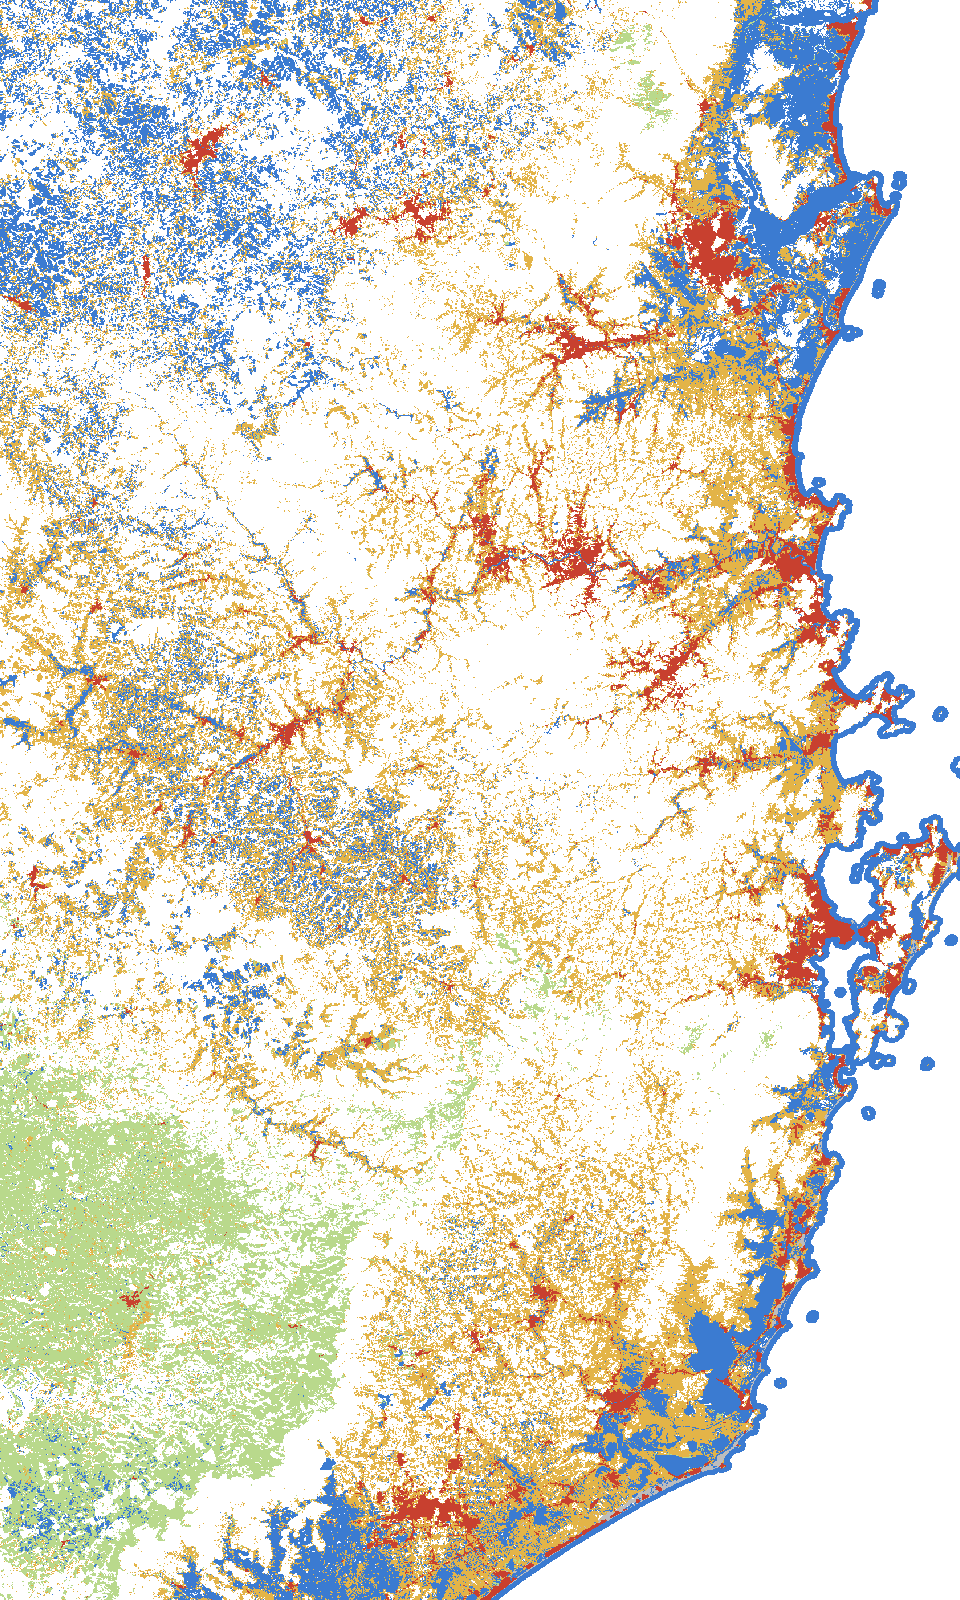
27 capitals, each with its own story: the capital and the regions of its state (coast, mountains, inland), with the INMET stations that support it. Hover a point on the map to see the capital enlarged; click to read the story.
How to cite: Biondo, Leandro M. (2026). Brazil’s capitals, read with one ruler. UmaTerra. https://umaterra.com.br/en/stories/capitals/
The stories are exploratory: generated with automatic measurements and processing, they form an interpretation of the data available in the UmaTerra platforms and have not been validated outside UmaTerra or peer reviewed.
Read the story →
Comparing the capitals
Hover a bar or a point to highlight the capital’s card.
Maximum temperature trend (°C per year, only trends with p < 0.05)Urban area (1985–2025, percentage points) against warming
By region
North
Manaus: annual rain rises in the metro area (p = 0.04). Belém: minimum rises strongly in the metro area (p < 0.01). Rio Branco: maximum and minimum rise in the metro area (p = 0.02 and 0.01). Macapá: maximum rises and rain falls (p = 0.03). Palmas and Porto Velho also warm.
Salvador: maximum rises inland (p = 0.01) and rain falls (p = 0.04). São Luís: maximum falls on the coast (p = 0.001). Recife: maximum rises in the metro area (p = 0.002). João Pessoa and Aracaju: maximum rises (p = 0.02 and 0.03). Maceió: rain falls strongly (p = 0.001 to 0.003).
Goiânia: maximum rises in all three regions, most on the plateau (p = 0.002). Cuiabá: maximum rises and rain falls in the south (p = 0.02). Campo Grande: maximum rises inland (p = 0.006). Brasília: the high plateau warms most strongly.
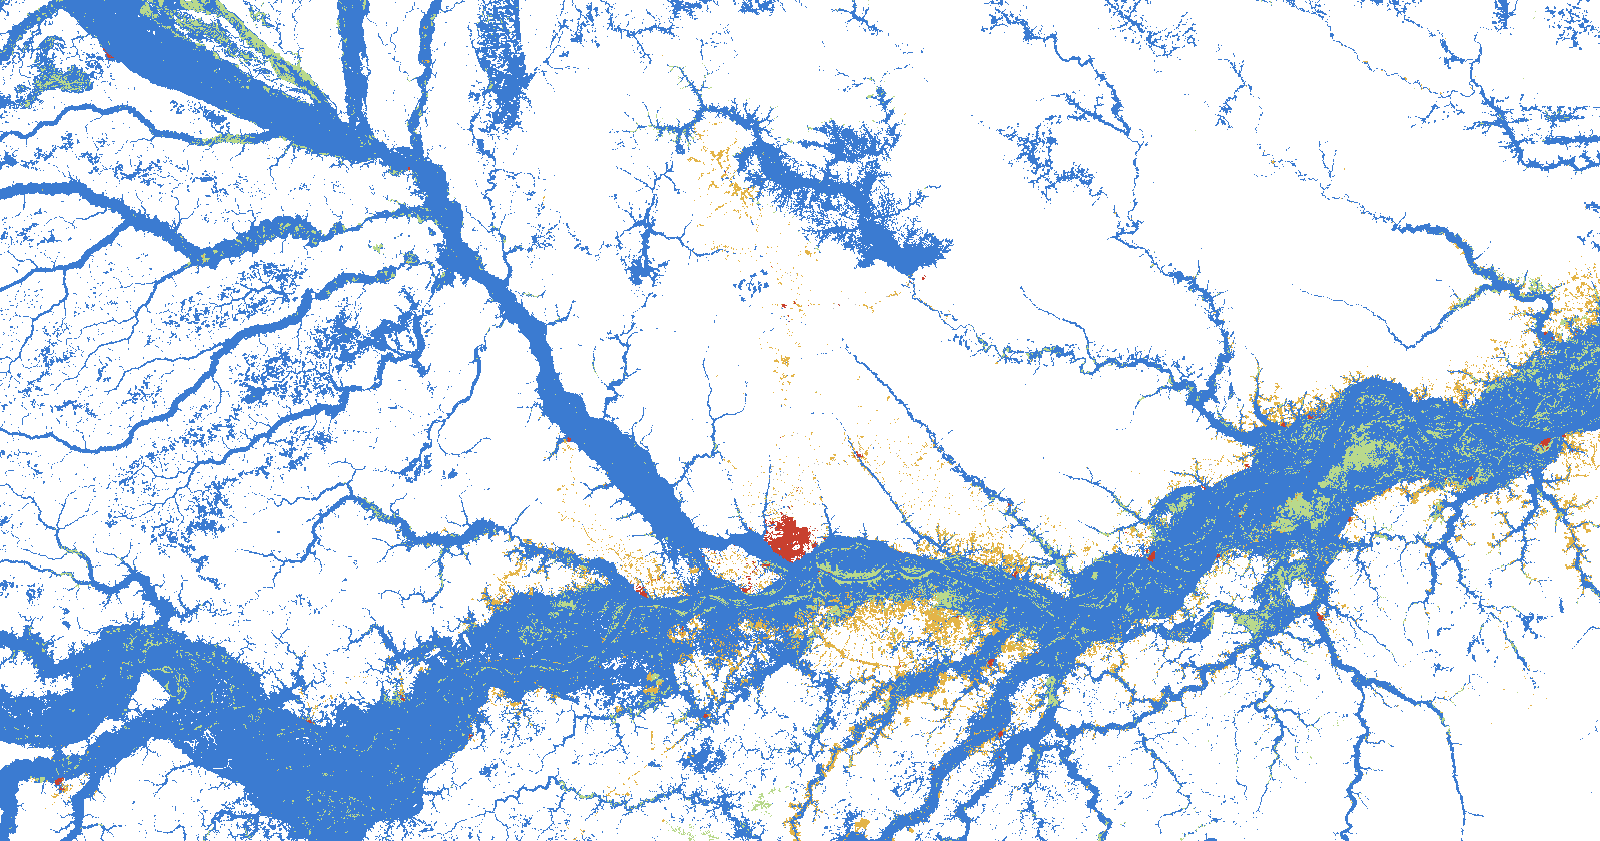 Manaus · AMManaus’s annual rain rises 28 mm a year in the metro, while the minimum temperature on the Rio Negro also rises.7 stations · Read the story →
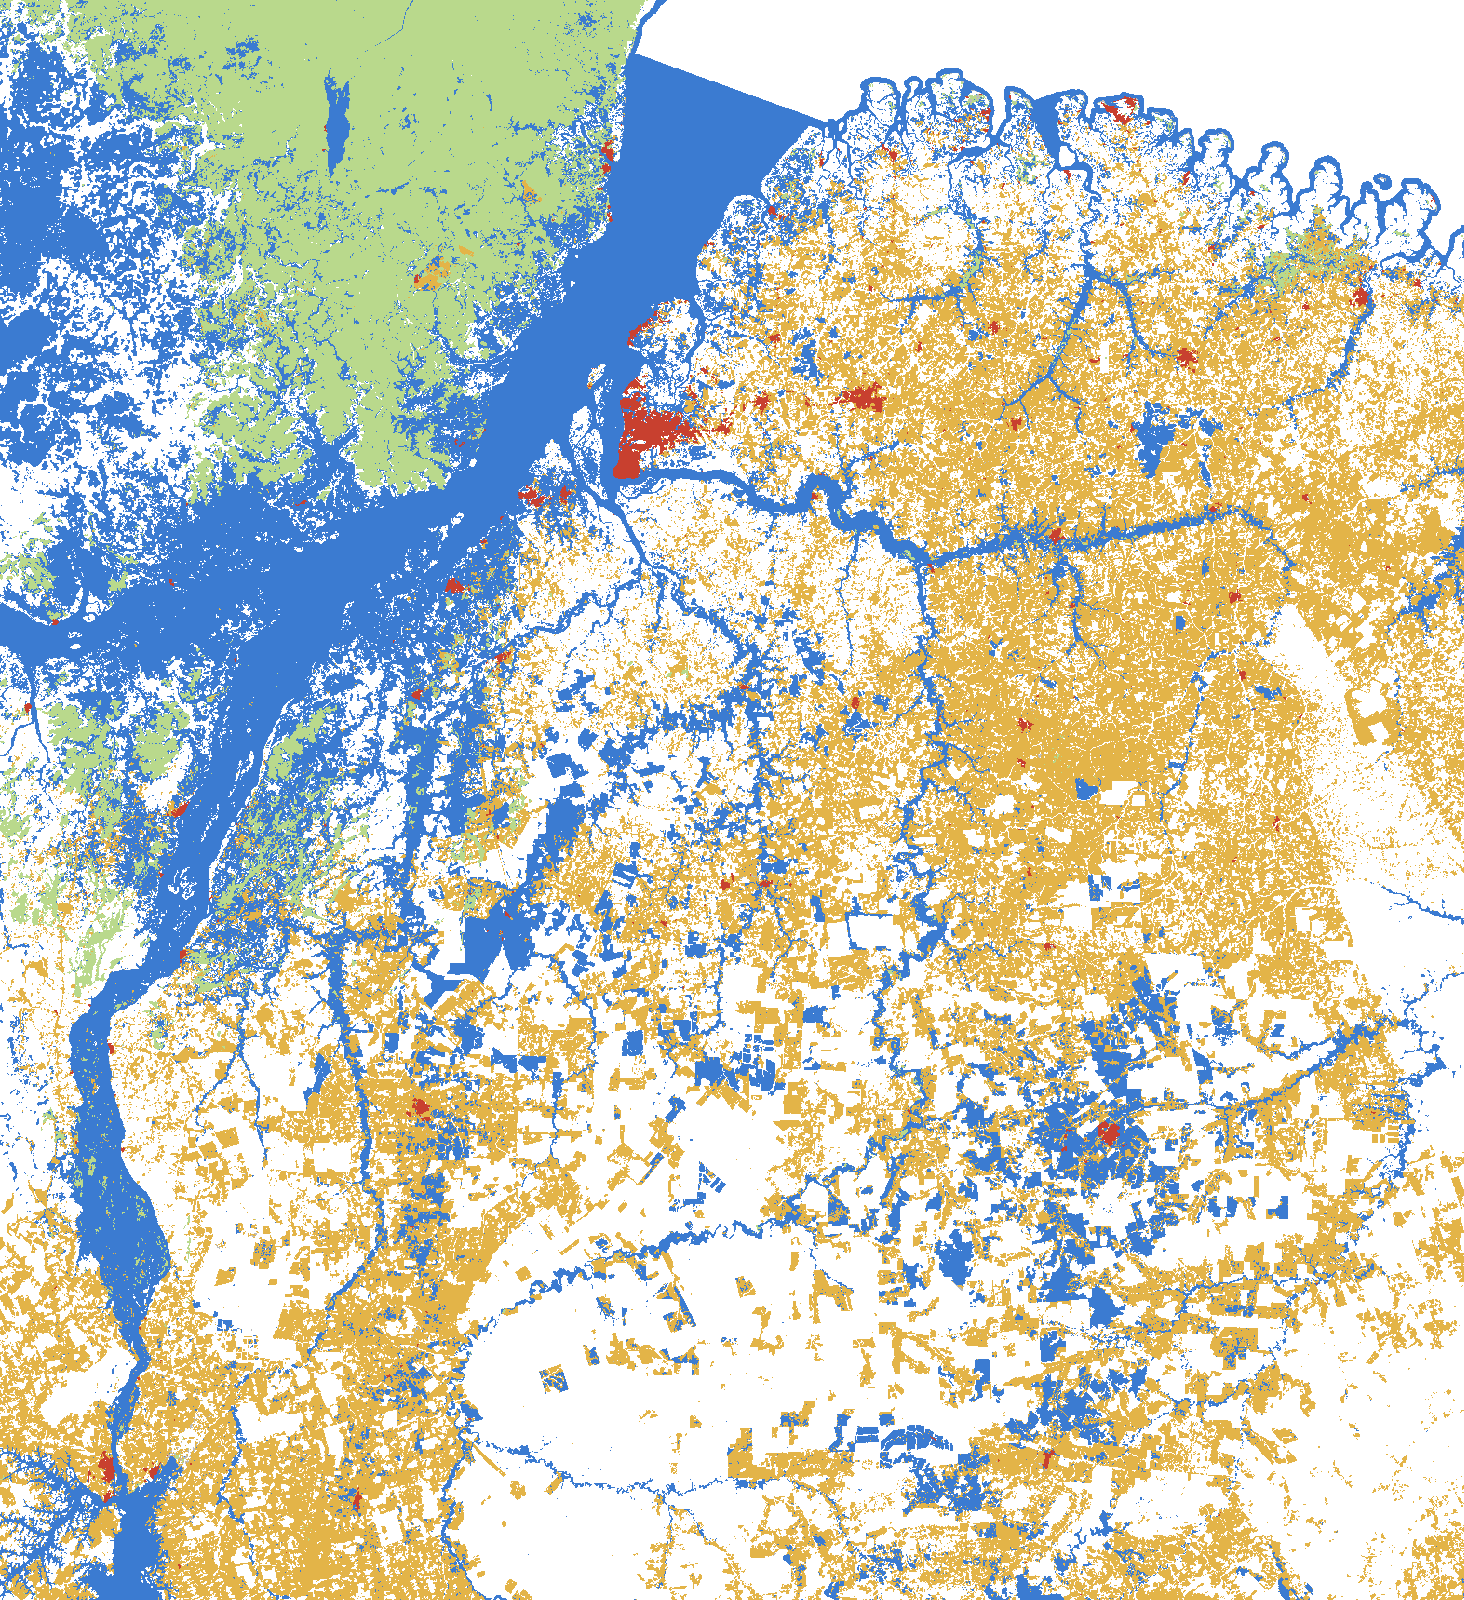 Belém · PABelém swapped 31 points of forest for urban area in 40 years, and the metro minimum rises strongly (p < 0.01).7 stations · Read the story →
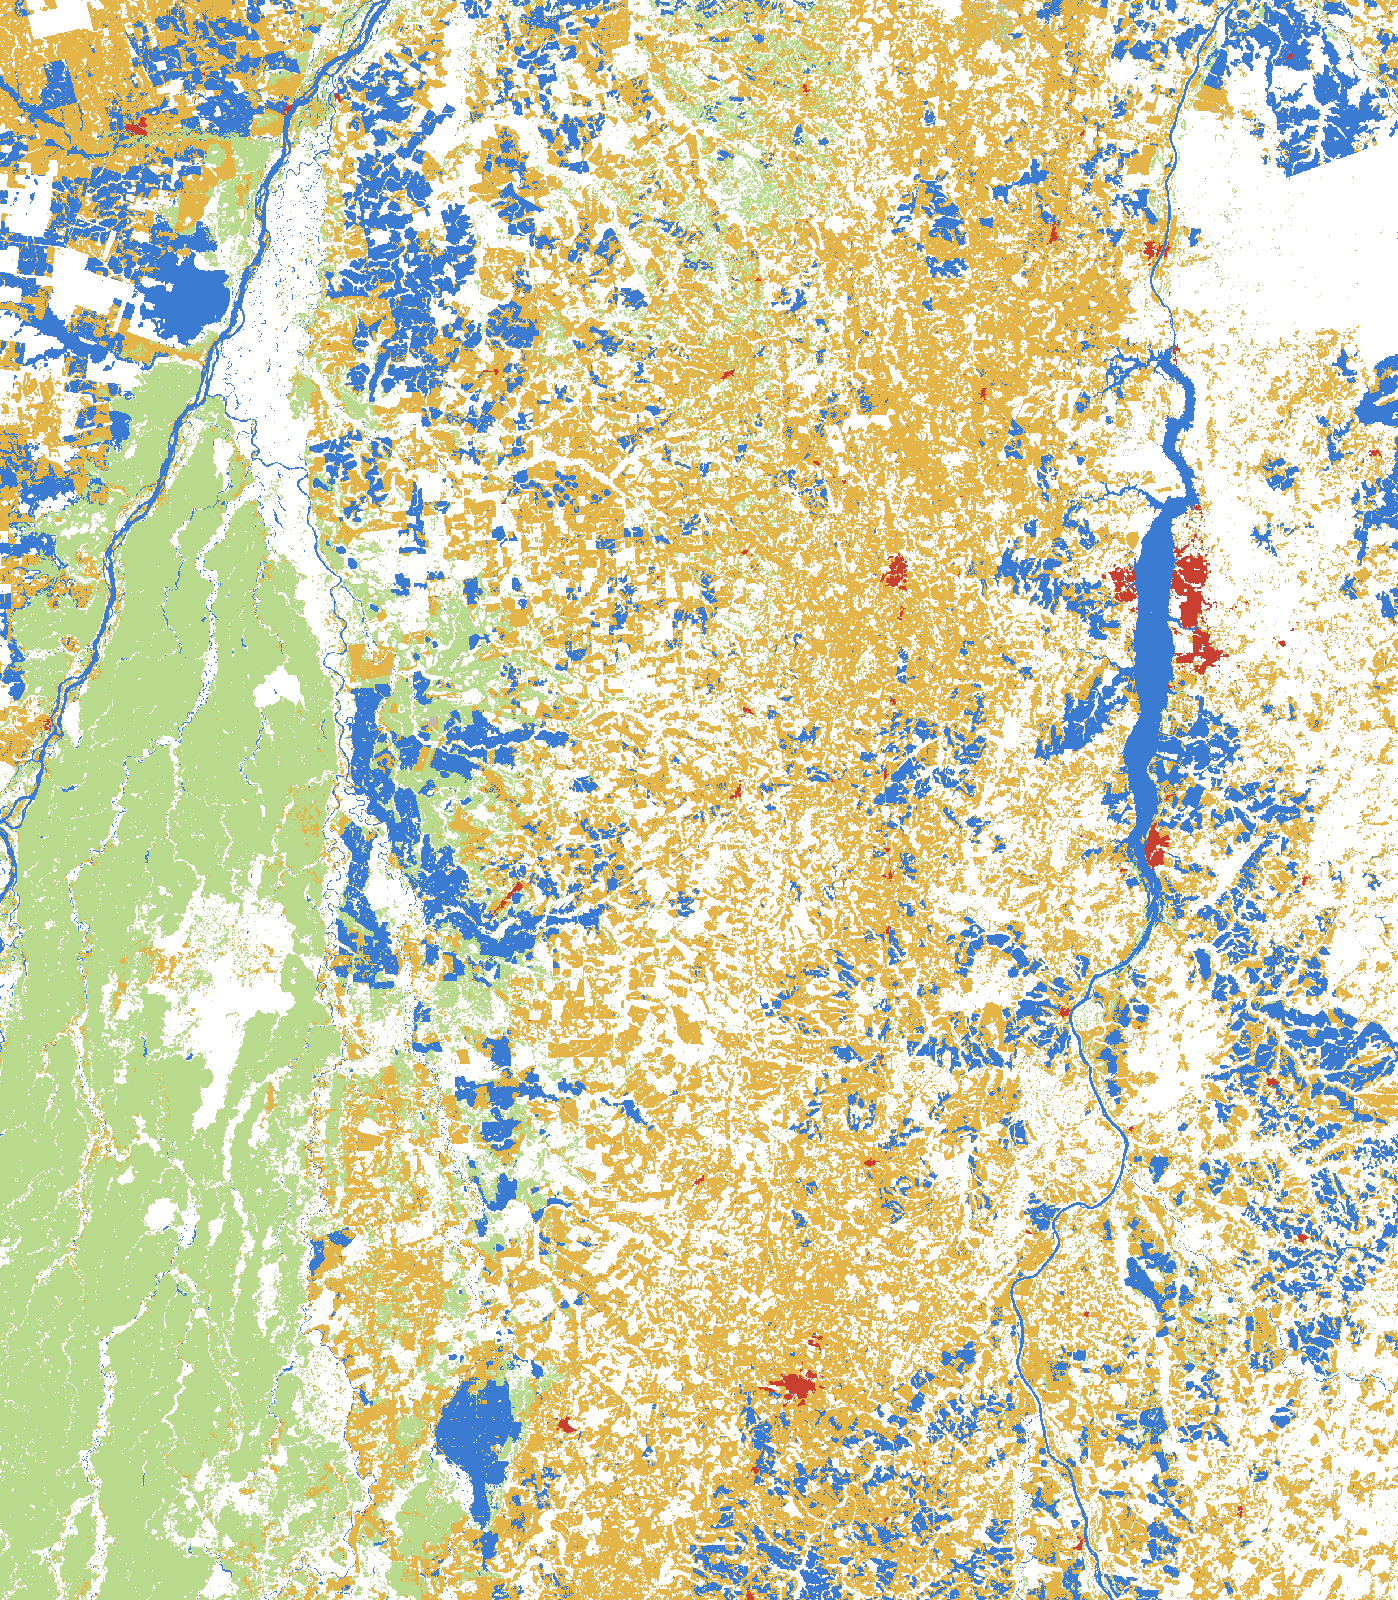 Palmas · TOPalmas’s metro warms 0.05 °C a year, with 17 more points of urban area and almost half of the box in protected areas.6 stations · Read the story →
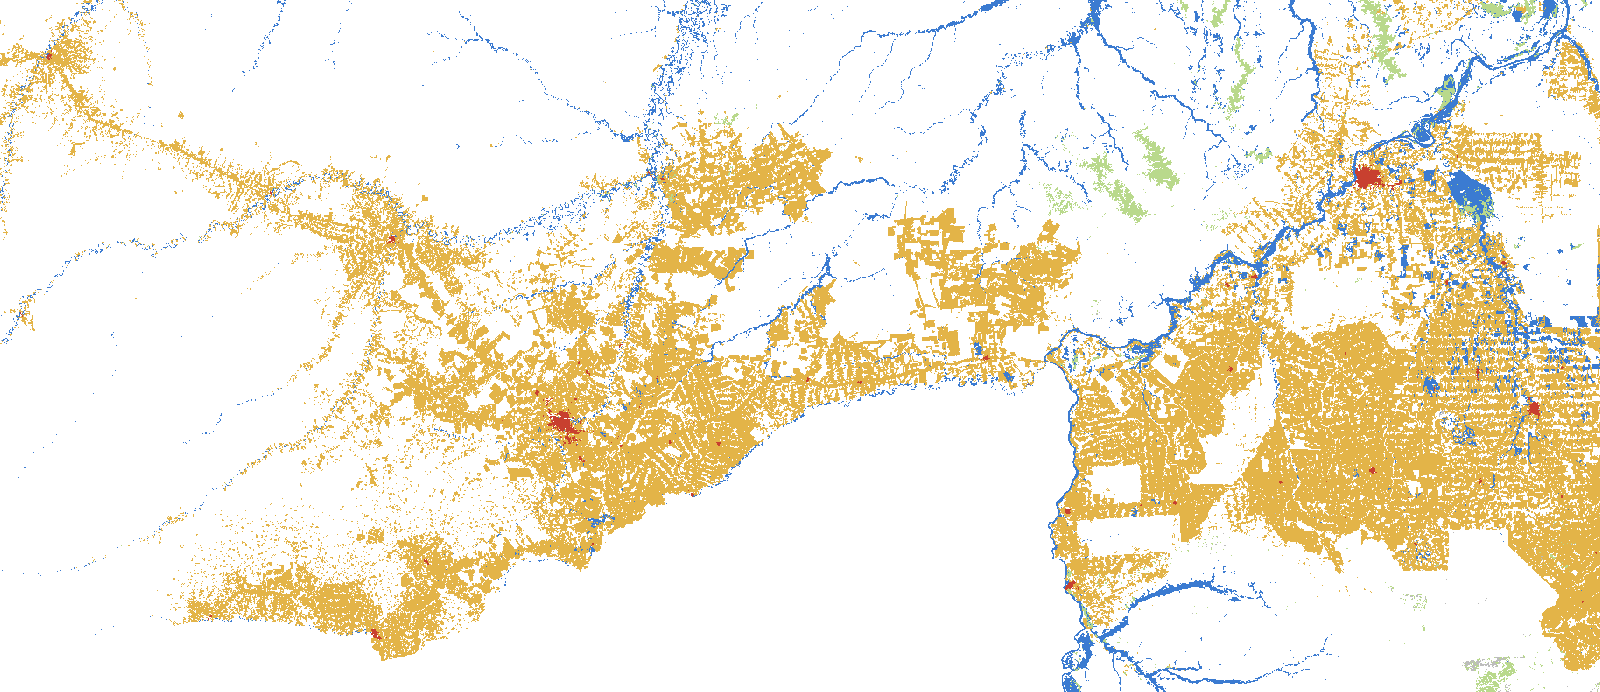 Porto Velho · ROOn Acre and Madeira, the minimum rises strongly (p < 0.001), and Porto Velho’s metro lost 26 points of forest in four decades.6 stations · Read the story →
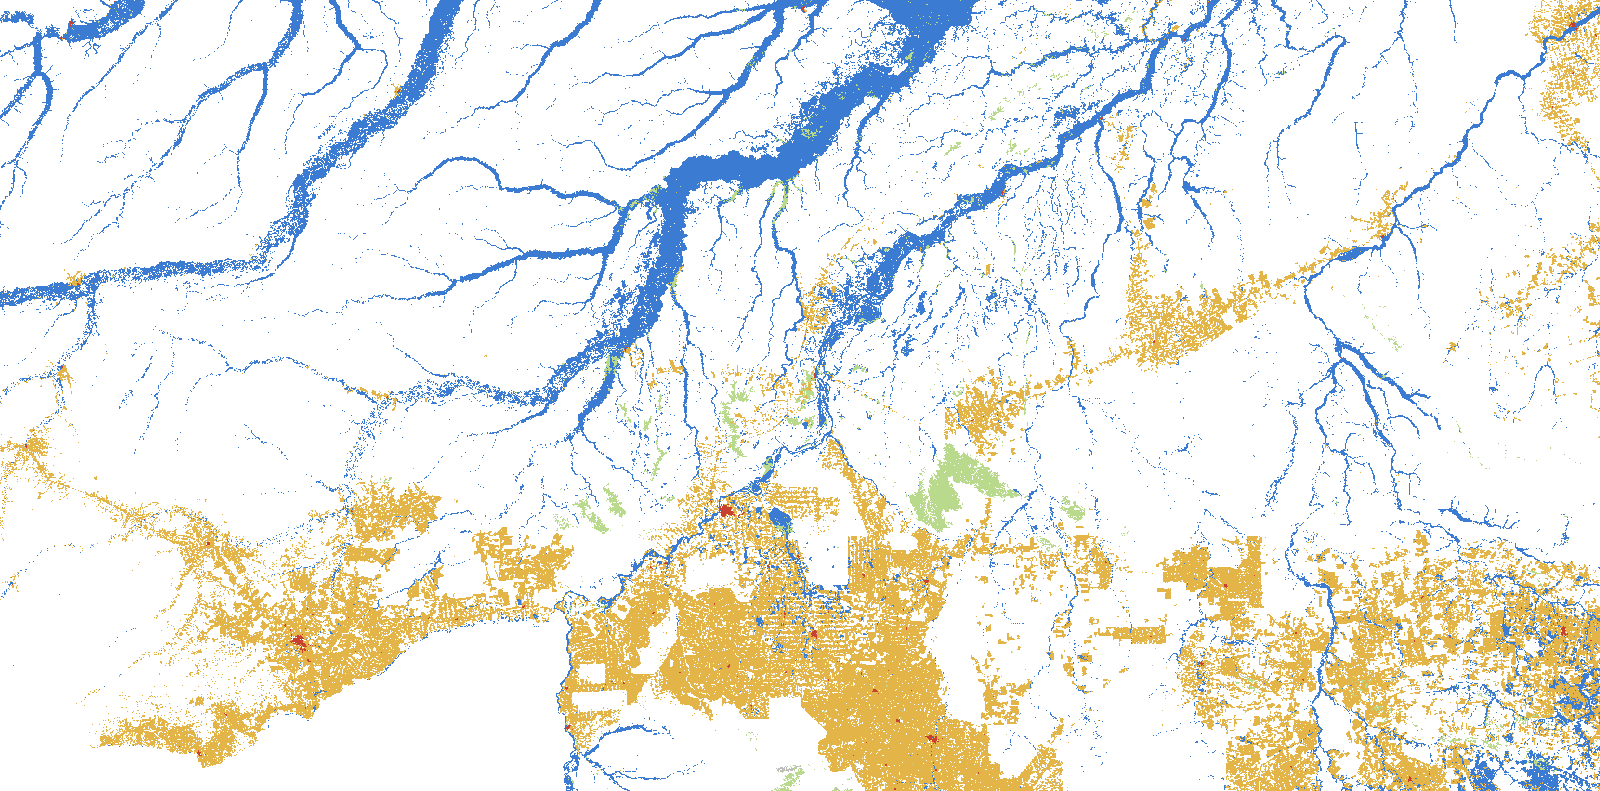 Rio Branco · ACRio Branco’s metro has maximum and minimum rising together (p = 0.02 and 0.01), and forest around it fell 41 points.5 stations · Read the story →
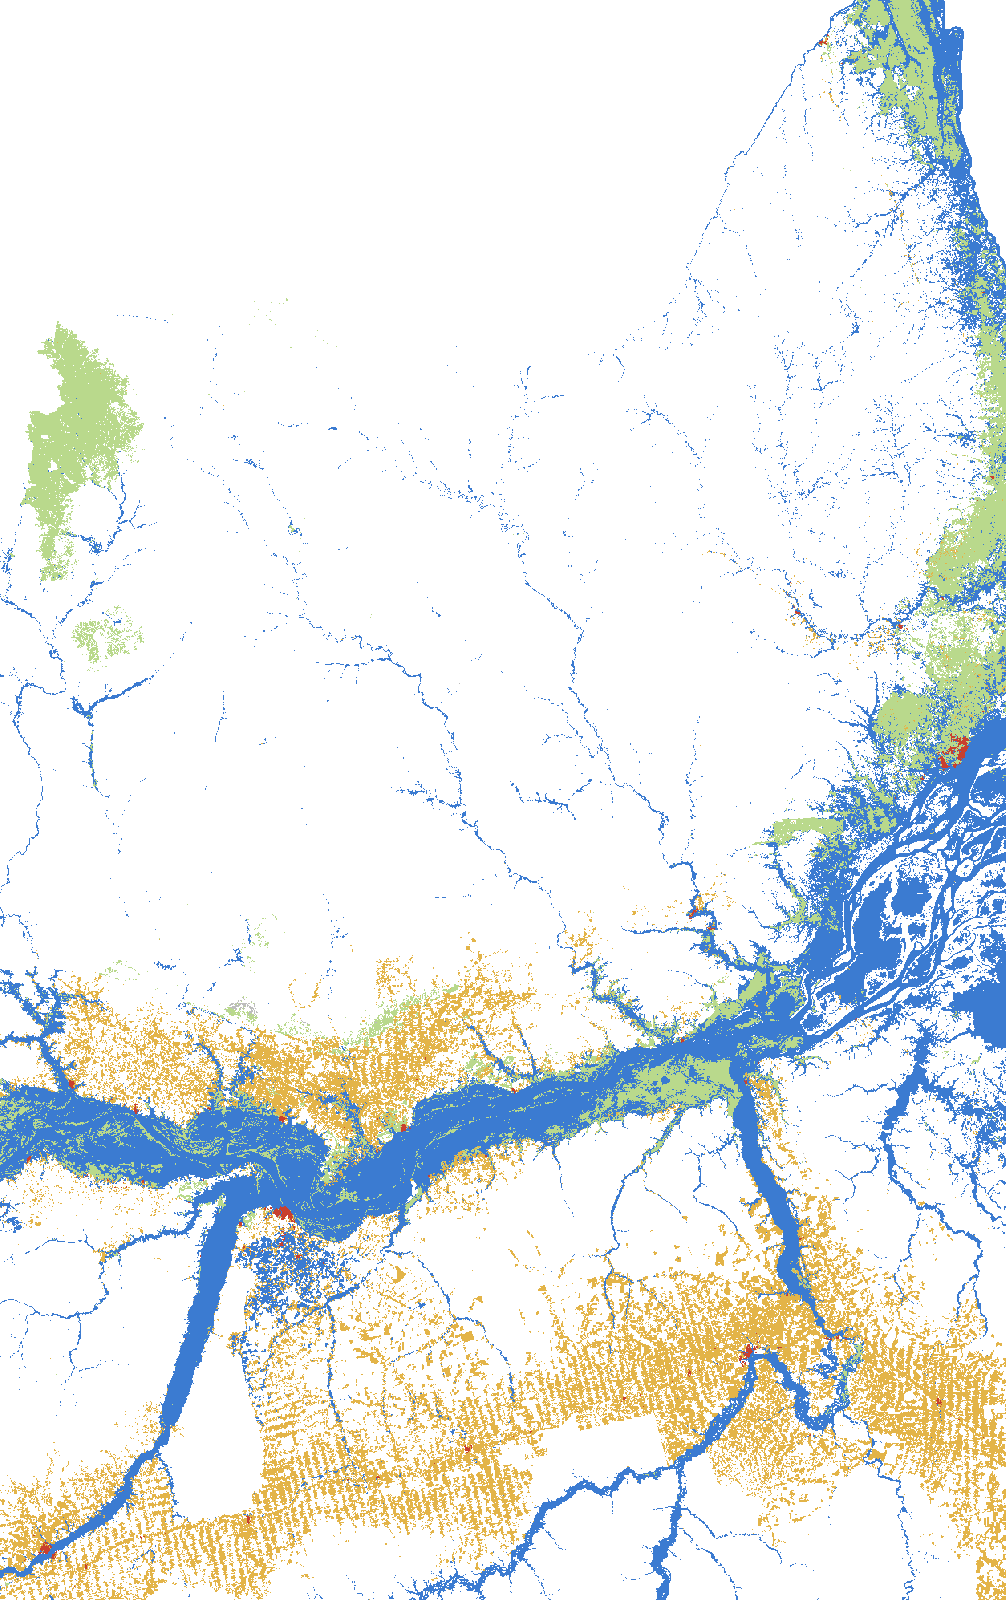 Macapá · AP + PAA mixed card: in Macapá maximum temperature rises and rain falls 73 mm a year, while the Pará Lower Amazon shows no clear trend.3 stations · Read the story →
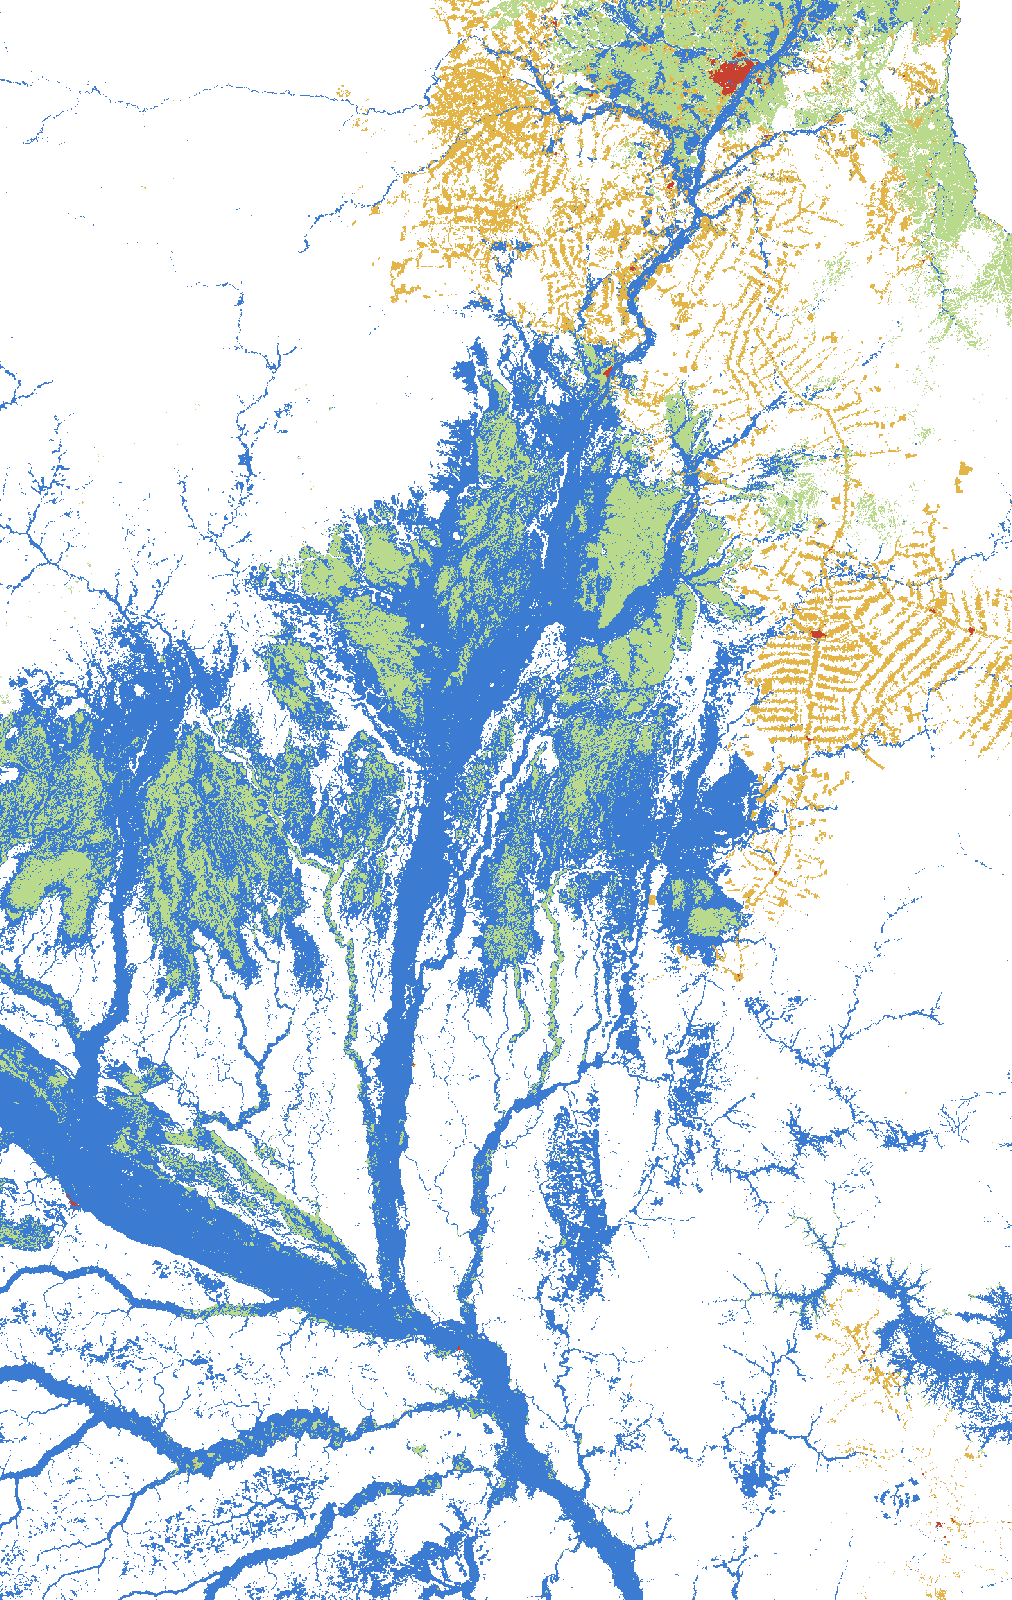 Boa Vista · RR + AMA mixed card: in Roraima there is no significant trend; on the Rio Negro, in Amazonas, the minimum temperature rises (p = 0.04).3 stations · Read the story →